MACD Crossover: Using MACD Line and Signal Line Crossovers for Entries
The MACD crossover uses the intersection of the MACD line and signal line as entry signals. Learn the exact conditions that make MACD crossovers reliable, the zone filter that improves accuracy, and common mistakes to avoid.
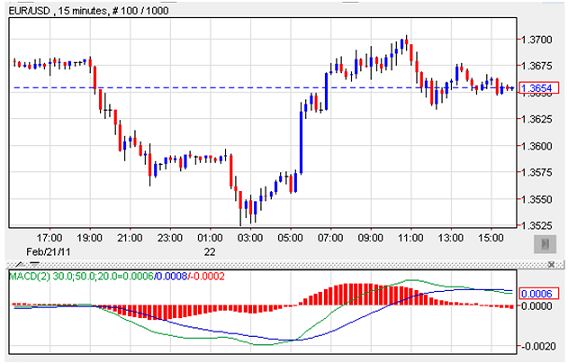
The MACD crossover is one of the most widely used entry signals in forex trading. When the MACD line crosses above the signal line, it signals bullish momentum. When it crosses below, bearish. Simple — but the signal’s reliability varies significantly depending on where the crossover occurs relative to the zero line.
The MACD Indicator
Calculation:
- MACD Line = 12-period EMA в€’ 26-period EMA
- Signal Line = 9-period EMA of the MACD Line
- Histogram = MACD Line в€’ Signal Line
The crossover: When the MACD line crosses the signal line, the histogram bar changes from positive to negative or vice versa. This is the visual signal.
Standard settings: 12/26/9 (fast/slow/signal). These are the most widely used defaults.
Entry Rules
Long Entry (Bullish Crossover)
| Condition | Requirement |
|---|---|
| MACD crossover | MACD line crosses above the signal line |
| Zone (critical) | Crossover occurs below the zero line (MACD was negative в†’ becoming less negative) |
| Histogram | Histogram bar turns from negative to positive |
| Entry | Long at next candle open |
| Stop-loss | Below the most recent swing low |
| Take-profit | 2Г— stop distance, or next resistance level |
Short Entry (Bearish Crossover)
| Condition | Requirement |
|---|---|
| MACD crossover | MACD line crosses below signal line |
| Zone | Crossover occurs above the zero line (MACD was positive в†’ becoming less positive) |
| Entry | Short at next candle open |
| Stop-loss | Above most recent swing high |
| Take-profit | 2Г— stop distance |
The Zone Filter: The Most Important Rule
Bullish crossovers are most reliable when they occur below the zero line.
When the MACD is below zero, the 12 EMA is below the 26 EMA — short-term momentum is already below the medium-term average. A crossover of the MACD line above the signal line at this point means momentum is beginning to recover from a weak position — a more significant signal than a crossover that occurs in already-positive territory.
Crossovers above the zero line (for longs) are late signals: MACD is already positive, meaning the trend has already established. A crossover here often occurs after much of the move has happened.
Mid-line crossovers (at or near zero): These occur during trend transitions and can be valid, but require additional confirmation (price action, key S/R level) before entering.
Adding the Trend Filter
MACD crossovers work best when aligned with the higher timeframe trend:
- Check the daily chart MACD position before trading any 4H crossover
- If the daily MACD histogram is positive (above zero): prefer bullish 4H crossovers only
- If the daily MACD histogram is negative: prefer bearish 4H crossovers only
This alignment eliminates the most common failure — entering a 4H bullish MACD crossover that contradicts the daily downtrend.
MACD Divergence (A Separate Application)
The MACD crossover for entries is separate from MACD divergence for reversal warnings:
- Divergence: Price makes a new high; MACD makes a lower high в†’ bearish divergence в†’ momentum weakening
- Divergence is NOT an entry signal by itself — it’s a warning to look for confirming patterns (head and shoulders, double top, etc.)
For complete MACD coverage including divergence, histogram interpretation, and multi-timeframe use, see the MACD Trading System strategy.
Common Mistakes
Taking every crossover: Many crossovers occur within a trend (the MACD fluctuates around the signal line during consolidation). Apply the zone filter and the trend filter rigorously.
Using on very short timeframes: On 15M charts, the 12/26/9 MACD generates dozens of crossovers daily. Signals degrade to noise. Use 4H or Daily for standard MACD crossover trading.
Ignoring the histogram’s size: A crossover where the histogram was deeply negative (large bars) and is now turning toward zero is more significant than one where the histogram was barely negative. The magnitude of the prior momentum matters.
Risk Management
| Parameter | Value |
|---|---|
| Risk per trade | 1% of account |
| Stop | Below recent swing low (long) or above (short) |
| Minimum RR | 1:2 |
| Filter | Zone filter + daily trend alignment required |
Use the position size calculator.
Key Takeaways
- MACD crossover: MACD line crossing signal line is the trigger; the histogram bar turning provides the visual cue
- Zone filter is non-negotiable: bullish crossovers are most reliable below the zero line; bearish crossovers above the zero line
- Align 4H MACD crossovers with the daily MACD direction (positive daily = prefer 4H longs; negative daily = prefer 4H shorts)
- Don’t use on timeframes below 1H — MACD generates too much noise at high frequencies with standard 12/26/9 settings
- The size of the prior histogram (how deeply negative/positive before the crossover) relates to signal significance — deeper extremes produce stronger crossover momentum
- For comprehensive MACD use including divergence and multi-timeframe analysis, see the MACD Trading System
Related strategies: MACD Trading System (complete guide)
Tools: Position Size Calculator
Risk Disclosure & Testing
Past performance of any trading strategy is not indicative of future results. Always backtest and forward test this strategy on a free demo account before committing real financial capital.

Practice This Strategy on a Live Demo
Choose an ECN broker with tight spreads and fast execution for strategy backtesting.