MACD Trading System: How to Use MACD for Forex Entry and Exit Signals
The MACD is a trend-following momentum indicator used by millions of traders. Learn the signal line crossover, histogram divergence, and zero-line strategies with exact entry/exit rules.
The MACD (Moving Average Convergence Divergence) is one of the oldest momentum indicators in technical analysis, developed by Gerald Appel in the late 1970s. It remains in active use because it elegantly captures both trend direction and momentum in a single panel.
Used naively, it generates endless false signals. Used with discipline — with trend filters, proper timeframes, and confirmation requirements — it can anchor a reliable trading system.
What MACD Measures
MACD is built from moving averages but measures the relationship between them rather than their absolute levels. The standard configuration uses three components:
| Component | Calculation | What It Shows |
|---|---|---|
| MACD Line | 12 EMA minus 26 EMA | Short-term momentum vs. long-term momentum |
| Signal Line | 9-period EMA of MACD Line | Smoothed MACD for crossover signals |
| Histogram | MACD Line minus Signal Line | Visual representation of the gap between MACD and Signal |
When the 12 EMA is above the 26 EMA, MACD is positive — meaning short-term momentum is stronger than long-term. When it crosses below zero, the reverse is true.
Standard MACD settings: 12 / 26 / 9 (the defaults in virtually all charting platforms). These work well for swing trading on 4H and Daily charts.
The Three Main MACD Signals
Signal 1: MACD Line / Signal Line Crossover
The most common MACD entry trigger. When the MACD line crosses above the signal line, it’s a potential long entry. When it crosses below, a potential short.
Long entry: MACD line crosses above signal line, preferably while both are still below zero (early upswing)
Short entry: MACD line crosses below signal line, preferably while both are still above zero (early downswing)
The crossover closest to zero (the centreline) tends to produce the strongest moves because it represents a genuine momentum shift rather than a minor oscillation.
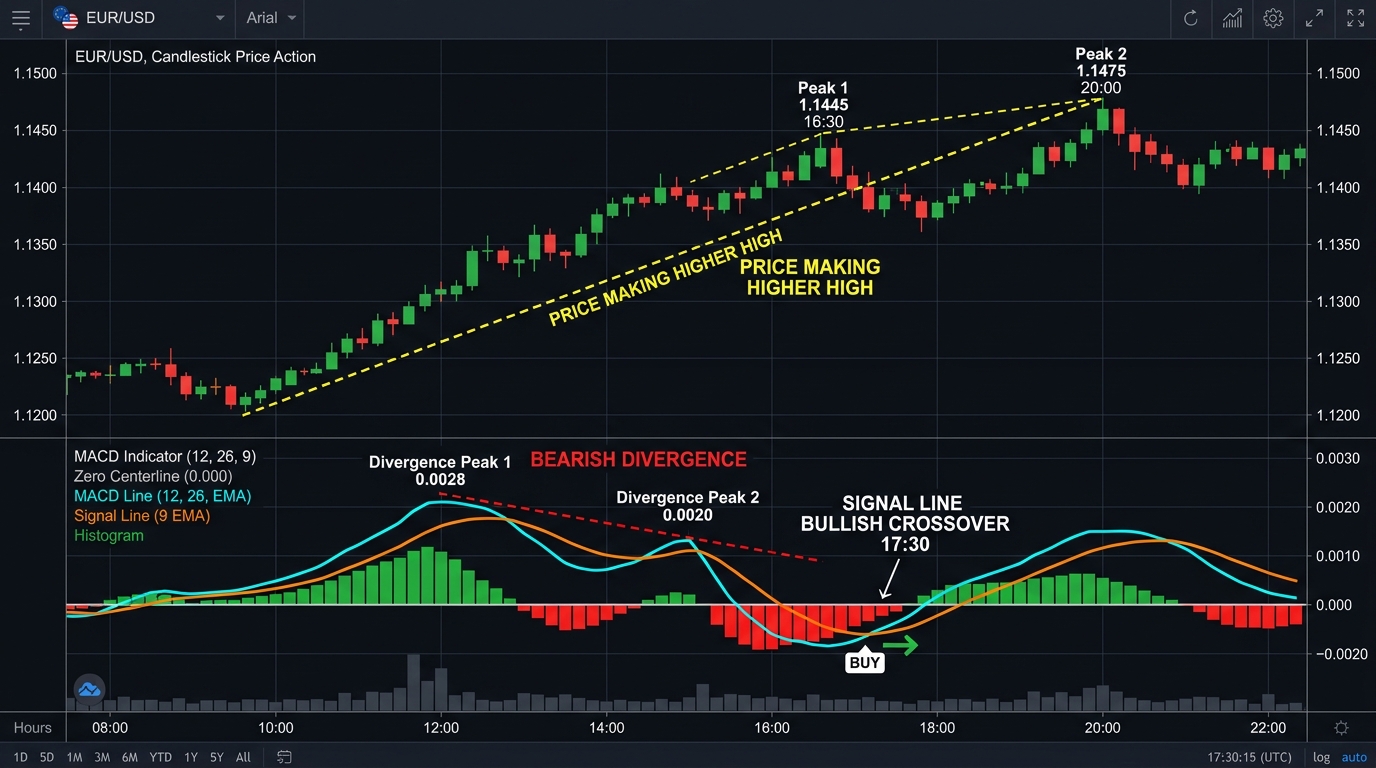
Signal 2: MACD Histogram Divergence
This is the higher-quality, lower-frequency signal that separates advanced MACD users from beginners.
Bearish histogram divergence:
- Price makes a higher high
- MACD histogram makes a lower high (peaks are shrinking)
- Interpretation: Bullish momentum is weakening — potential reversal
Bullish histogram divergence:
- Price makes a lower low
- MACD histogram makes a higher low (troughs are shrinking)
- Interpretation: Bearish momentum is weakening — potential reversal
Histogram divergence signals are typically more reliable than simple line crossovers because they capture a process (momentum deterioration) rather than a single event.
Signal 3: Zero-Line Cross
When the MACD line crosses above zero, it indicates the 12 EMA has crossed above the 26 EMA — the equivalent of a short-term moving average crossover. This is a trend-direction signal rather than a precise entry:
- MACD above zero: Look for long setups only
- MACD below zero: Look for short setups only
The zero-line cross is most useful as a higher-timeframe filter: if daily MACD is above zero, only take long signals on the 4H chart.
Entry and Exit Rules
System 1: Signal Line Crossover
| Step | Action |
|---|---|
| 1. Trend direction | Daily MACD above zero = bullish context; below zero = bearish |
| 2. Long signal | 4H MACD line crosses above signal line, preferably below zero |
| 3. Short signal | 4H MACD line crosses below signal line, preferably above zero |
| 4. Confirmation | The histogram bar following the crossover expands in signal direction |
| 5. Entry | Next candle open after confirmation |
| 6. Stop-loss | Below recent swing low (long) or above recent swing high (short) |
| 7. Exit | When MACD line crosses back through signal line |
System 2: Histogram Divergence Entry
| Step | Action |
|---|---|
| 1. Identify divergence | Price makes new extreme; histogram peaks/troughs are shrinking |
| 2. Confirmation | Histogram bar turns in the opposite direction (first reversal bar) |
| 3. Entry | Next candle open |
| 4. Stop-loss | Beyond the price extreme at the time of the final divergence peak |
| 5. Take-profit | Key S/R level or 2x risk distance |
MACD on Different Timeframes
| Timeframe | Signal Frequency | Best Use |
|---|---|---|
| 15m | High (many false signals) | Day trading in trending sessions only |
| 1H | Moderate | Day trading with daily trend filter |
| 4H | Balanced | Swing trading — optimal for this system |
| Daily | Low (few but strong signals) | Position trading, trend confirmation |
For most traders, the 4H chart with a Daily MACD filter is the most practical application.
Risk Management Parameters
| Parameter | Recommendation |
|---|---|
| Risk per trade | 1% of account |
| Minimum RR ratio | 1:2 |
| Stop-loss | Structural (swing high/low), not fixed pips |
| Maximum trades | 2 with MACD system simultaneously |
| Avoid | Trading MACD crossovers when ADX < 20 (ranging market) |
Advantages and Disadvantages of MACD
| Aspect | Detail |
|---|---|
| Advantage | Combines trend direction and momentum in one indicator |
| Advantage | Histogram divergence provides early warning of reversals |
| Advantage | Works on all timeframes; highly configurable |
| Disadvantage | Lagging indicator — signals arrive after the move has started |
| Disadvantage | Generates false signals in ranging, choppy markets |
| Disadvantage | Many crossovers in low-volatility conditions produce noise |
Combining MACD With Other Indicators
MACD + RSI: When MACD shows a bullish crossover and RSI simultaneously shows divergence from oversold, the combined signal is significantly stronger. Both indicators confirming the same potential reversal is a notable confluence.
MACD + 200 SMA: Use the 200 SMA on the daily chart to define trend direction. Only take MACD long signals when price is above the 200 SMA; only take short signals when below.
MACD + Volume: A MACD crossover on above-average volume is more likely to follow through than one on thin, quiet price action.
Modified MACD Settings
The default 12/26/9 settings work well for swing trading on 4H and Daily. Some traders adjust:
| Settings | Effect | Best For |
|---|---|---|
| 12 / 26 / 9 (default) | Balanced, moderate sensitivity | Swing trading 4H/Daily |
| 5 / 35 / 5 | More responsive, noisier | Short-term day trading |
| 8 / 21 / 5 | Slightly faster, fewer signals | 1H trading |
| 24 / 52 / 18 | Slower, fewer but stronger signals | Weekly position trades |
Practical Example: EUR/USD 4H, February 2025
Setup: EUR/USD on 4H chart, February 2025.
- Daily MACD crosses above zero (bullish context)
- 4H: MACD histogram shows bullish divergence (price making lower low, histogram making higher low)
- First green histogram bar appears at 1.0490
Entry: Long at 1.0500
Stop-loss: Below swing low at 1.0450 (50 pips)
Target: Key resistance at 1.0630 (130 pips, approximately 1:2.6 RR)
Result: Price reaches 1.0650 within the next 8 days. Target exceeded.
This is a textbook histogram divergence setup with higher-timeframe alignment. The key was waiting for the first green histogram bar as confirmation rather than trying to call the exact bottom.
Key Takeaways
- MACD measures the relationship between the 12 and 26 EMA, represented through a MACD line, signal line, and histogram
- Three main signals: signal line crossover (most common), histogram divergence (highest quality), and zero-line cross (trend direction filter)
- The histogram divergence signal is more reliable than the simple line crossover because it captures a process of momentum deterioration
- The optimal configuration for swing traders: 4H chart, default 12/26/9 settings, filtered by daily MACD direction
- Filter out false crossovers by requiring ADX above 20 and confirmation from the histogram expanding in the signal direction
- MACD works best in trending markets; in ranging conditions it generates significant noise
Related strategies: RSI Strategy | MACD Crossover | EMA Crossover and ADX
Related lessons: Moving Averages | SMA vs. EMA
Tools: Position Size Calculator
Risk Disclosure & Testing
Past performance of any trading strategy is not indicative of future results. Always backtest and forward test this strategy on a free demo account before committing real financial capital.

Practice This Strategy on a Live Demo
Choose an ECN broker with tight spreads and fast execution for strategy backtesting.