Momentum Indicators in Forex: How to Read and Trade Market Momentum
Momentum indicators measure the speed of price movement, not just direction. Learn how MACD, RSI, CCI, and Williams %R reveal when momentum is accelerating or fading — and how to use this to time entries and exits.
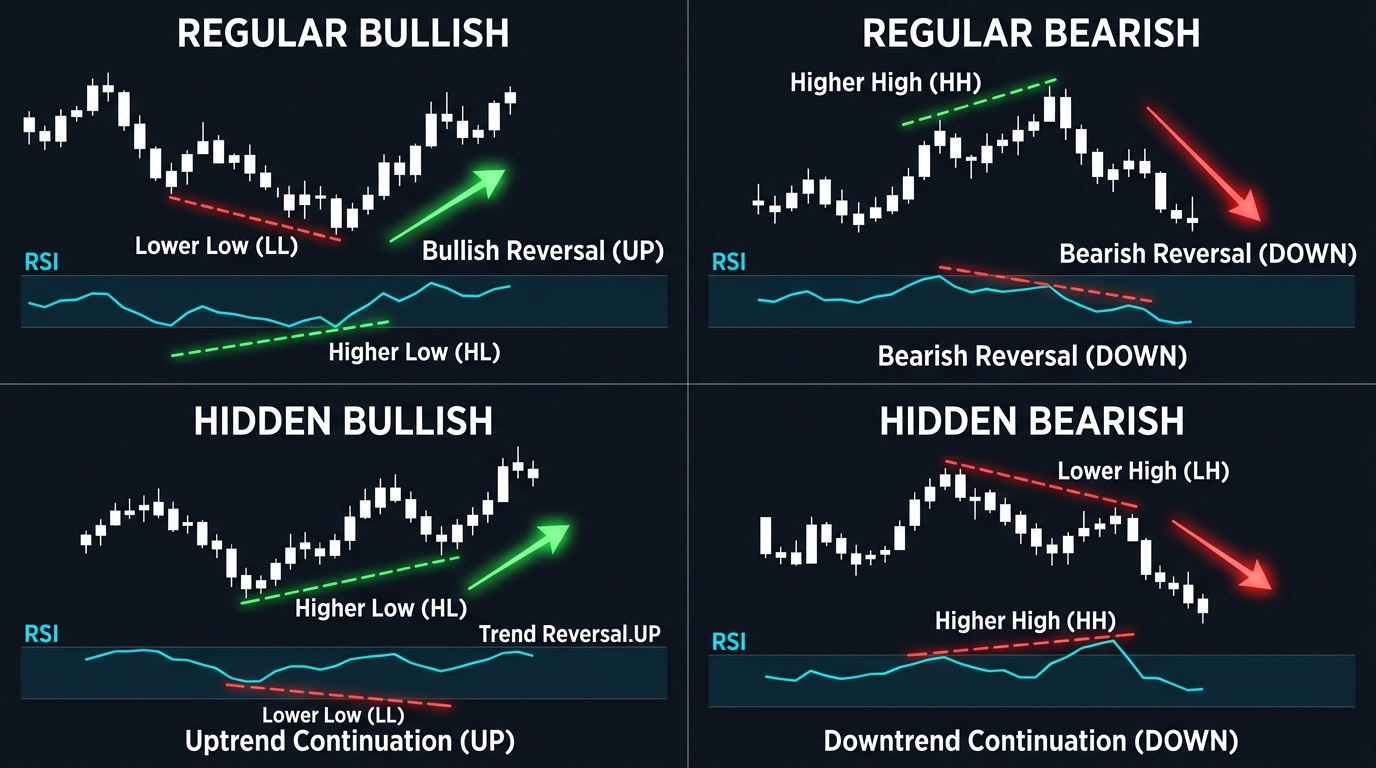
Price direction tells you where the market is going. Momentum tells you how fast it’s getting there — and more importantly, whether that speed is accelerating or decelerating. A trend that’s losing momentum is often hours or days from reversing. A consolidation period where momentum is building quietly often precedes the next explosive move.
Trading momentum indicators is not the same as trading trend indicators. This distinction matters because the setups are different, the risks are different, and the timing is fundamentally different.
What Momentum Measures
Momentum is the rate of change in price over a given period. If EUR/USD closes at 1.0850 today and was at 1.0800 ten periods ago, the momentum is +50 pips. If it was at 1.0900 ten periods ago, the momentum is -50 pips.
Momentum indicators translate this into an oscillator (bounded range) or divergence analysis. The core insight they provide:
- Rising momentum: The move is accelerating — trend is healthy
- Falling momentum: The move is decelerating — potential reversal building
- Momentum divergence: Price makes a new extreme, momentum does not — this is the most significant signal
Indicator 1: MACD (Moving Average Convergence Divergence)
Already covered in depth in the MACD trading system lesson. As a momentum indicator specifically:
Momentum reading from MACD histogram:
- Expanding histogram bars (bars getting taller) → momentum is increasing in that direction
- Contracting histogram bars (bars getting shorter) → momentum is weakening
- Histogram crossing zero → momentum has reversed
The histogram is MACD’s most sensitive momentum component. Traders who only watch the line crossovers miss the earlier warning signal that comes when the histogram bars start shrinking.
Standard settings: 12/26/9. Best on 4H and Daily.
Indicator 2: RSI (Relative Strength Index)
Covered in detail in the RSI strategy lesson. As a momentum indicator:
RSI as momentum gauge (not just overbought/oversold):
- RSI above 60: Bullish momentum dominant
- RSI between 40–60: Neutral; no clear momentum direction
- RSI below 40: Bearish momentum dominant
- RSI above 70 in a strong uptrend: Confirms momentum is strong — not a reversal signal
- RSI below 30 in a strong downtrend: Confirms momentum is strong — not a buy signal
The key insight that beginners miss: in a trending market, RSI as a pure momentum indicator is more useful than RSI as an overbought/oversold tool. Keep RSI above 50 = stay long; RSI below 50 = stay short.
RSI momentum divergence (the highest-quality signal):
- Price makes new high, RSI makes lower high → momentum is fading, reversal likely
- Price makes new low, RSI makes higher low → selling momentum is fading, reversal likely
Standard settings: 14-period. Overbought: 70. Oversold: 30.
Indicator 3: CCI (Commodity Channel Index)
The CCI was developed by Donald Lambert in 1980 and measures the deviation of price from its statistical mean. Despite the name, it’s widely applied in forex.
How CCI works:
CCI = (Typical Price - SMA) / (0.015 × Mean Deviation)Where Typical Price = (High + Low + Close) / 3
The result oscillates primarily between -200 and +200, with extreme readings above +100 or below -100 signaling momentum extremes.
CCI reading guide:
| CCI Level | Signal |
|---|---|
| Above +200 | Extreme overbought momentum |
| +100 to +200 | Strong bullish momentum |
| 0 to +100 | Mild bullish momentum |
| -100 to 0 | Mild bearish momentum |
| -100 to -200 | Strong bearish momentum |
| Below -200 | Extreme oversold momentum |
CCI Trading Rules:
Zero-line cross strategy (trend following):
- Long entry: CCI crosses above 0 from below with trend confirmation
- Short entry: CCI crosses below 0 from above
- Exit: Opposite zero-line cross
Extreme reversal strategy (range trading):
- Long entry: CCI drops below -100, then crosses back above -100
- Short entry: CCI rises above +100, then crosses back below +100
- This is the same logic as RSI/Stochastic overbought-oversold — only valid in ranging markets
CCI divergence:
- Identical to RSI divergence: price makes new extreme while CCI fails to confirm → momentum reversal signal
Settings: 14-period (default). 20-period produces smoother, less frequent signals.
Indicator 4: Williams %R
Developed by Larry Williams, the Williams %R is essentially an inverted Stochastic oscillator. It measures where the current close sits within the recent high-low range on a scale of 0 to -100.
Reading:
- 0 to -20: Overbought (price closing near recent high)
- -20 to -80: Neutral zone
- -80 to -100: Oversold (price closing near recent low)
Note the inverted scale: 0 is at the top (overbought), -100 at the bottom (oversold). This trips up many beginners coming from Stochastic.
Williams %R trading rules:
| Signal | Condition |
|---|---|
| Long entry | %R drops below -80, then crosses back above -80 (oversold exit) |
| Short entry | %R rises above -20, then crosses back below -20 (overbought exit) |
| Trend confirmation | %R staying in 0 to -50 range = sustained bullish momentum |
| Trend confirmation | %R staying in -50 to -100 range = sustained bearish momentum |
Williams %R is particularly effective when combined with a basic moving average trend filter. If 50 SMA is sloping up (uptrend), only take Williams %R long signals; if sloping down, only take shorts.
Settings: 14-period (default). 10-period for faster response on shorter timeframes.
Comparing the Four Momentum Indicators
| Feature | MACD | RSI | CCI | Williams %R |
|---|---|---|---|---|
| Scale | Unbounded | 0–100 | Unbounded (-300 to +300) | 0 to -100 |
| Overbought/Oversold | No direct level | 70/30 | +100/-100 | -20/-80 |
| Best for | Trend momentum + divergence | Overbought/oversold + divergence | Extreme momentum reading | Quick reversal signals |
| Divergence signals | Yes (histogram) | Yes | Yes | Yes |
| Signal speed | Moderate | Moderate | Fast | Very fast (near real-time) |
| Best timeframe | 4H/Daily | 4H/Daily | 1H/4H | 1H/4H |
Building a Momentum-Based Strategy
A practical momentum setup combining two indicators for confirmation:
Upside momentum entry:
- Trend direction: Price above 200 SMA on daily (uptrend)
- Primary signal: RSI pulls back to 40–50 zone, then bounces upward
- Confirmation: MACD histogram turns positive (first green bar after red)
- Entry: Next 4H candle open after both signals confirm
- Stop-loss: Below the swing low that formed during the RSI pullback
- Take-profit: Previous swing high or 2x risk distance
- Exit management: Close if RSI drops below 50 for two consecutive 4H closes
Momentum exhaustion signal (potential reversal):
- Price makes new high (or low)
- RSI, CCI, or Williams %R do NOT confirm the new extreme
- MACD histogram has been declining for 3+ bars
- Three indicators all showing divergence → high-conviction reversal signal
- Wait for a confirmation candle before entering
Multiple divergences across several indicators simultaneously is a rare but high-probability signal. When it appears, it commands attention.
Key Takeaways
- Momentum indicators measure the speed of price movement, not just its direction — decelerating momentum often precedes reversal before price itself turns
- Four core momentum indicators: MACD (trend momentum + histogram divergence), RSI (momentum zones + divergence), CCI (extreme momentum readings + zero-line cross), Williams %R (fast reversal timing)
- Momentum divergence — price making a new extreme while the indicator fails to confirm — is the highest-quality signal any momentum oscillator produces
- In trending markets, use momentum indicators for trend confirmation (RSI staying above 50, MACD histogram positive) rather than overbought/oversold reversal signals
- Combine two momentum indicators for confirmation: a primary signal from RSI or CCI and a confirmation from MACD histogram direction
- Multiple indicators showing divergence simultaneously (RSI + CCI + MACD) is rare but represents a high-conviction reversal setup
Related strategies: RSI Strategy | MACD Trading System | Stochastic High Low
Tools: Position Size Calculator
Risk Disclosure & Testing
Past performance of any trading strategy is not indicative of future results. Always backtest and forward test this strategy on a free demo account before committing real financial capital.

Practice This Strategy on a Live Demo
Choose an ECN broker with tight spreads and fast execution for strategy backtesting.