Moving Averages Crossover Strategy: Fast, Slow, and How to Filter the Noise
The moving average crossover is one of the most-traded strategies in forex. Learn fast and slow MA crossover setups, the golden cross, entry/exit rules, and how to filter false signals in 2026.
The moving average crossover is probably the most widely known technical strategy in forex. It is also one of the most misused. Traders see two lines cross on a chart and click “buy” without understanding why it works, when it fails, and what additional confirmation separates useful signals from noise.
This lesson covers both the fast and slow crossover variants, the mechanics behind the signals, and the filters you need to make this strategy worth trading in 2026.
Why Moving Average Crossovers Work
A moving average smooths out price data over a defined period, creating a line that reflects the average price. When a short-period (fast) moving average crosses above a long-period (slow) moving average, it signals that recent prices have risen above the longer-term average — a potential shift in momentum.
The crossover doesn’t predict the future. It confirms that a shift in momentum has already begun. This is a lagging signal by design. The tradeoff: you sacrifice the earliest entry to get a more confirmed, higher-probability one.
The Two Main Systems
System 1: Fast Crossover (10 / 25 / 50 EMA)
This system uses three EMAs and requires both crossovers to confirm:
| Setting | Value |
|---|---|
| Fast EMA | 10-period |
| Medium EMA | 25-period |
| Slow EMA | 50-period |
| Timeframe | 1H or 4H |
| Pairs | Any major pair |
Long entry: 10 EMA crosses above 25 EMA and continues through 50 EMA. Wait for the current candle to close above 50 EMA before entering.
Short entry: 10 EMA crosses below 25 EMA and continues through 50 EMA. Wait for the current candle to close below 50 EMA before entering.
Exit — Option A: When 10 EMA crosses back through 25 EMA in the opposite direction.
Exit — Option B: When 10 EMA returns to touch the 50 EMA (again, wait for candle close on the far side of 50 EMA).
The “wait for candle close” rule is critical. Crossovers that appear intrabar often reverse before the candle closes. Executing on the close prevents the most common false entry.
System 2: Slow Crossover (7 / 14 / 21 SMA)
The slow system uses simple moving averages in multiples of 7. It generates fewer signals but each signal is more meaningful because it reflects a more sustained momentum shift.
| Setting | Value |
|---|---|
| Fast SMA | 7-period |
| Medium SMA | 14-period |
| Slow SMA | 21-period |
| Timeframe | 4H or Daily |
| Pairs | Any major pair |
Long entry: 7 SMA crosses above 14 SMA and continues through 21 SMA. Wait for the current bar to close.
Short entry: 7 SMA crosses below 14 SMA and continues through 21 SMA.
Exit: When 7 SMA returns to touch the 21 SMA.
Because SMA signals confirm only after the current bar closes, this system requires periodic monitoring rather than constant attention. Check at the open of each new candle — not in between.
The Golden Cross and Death Cross
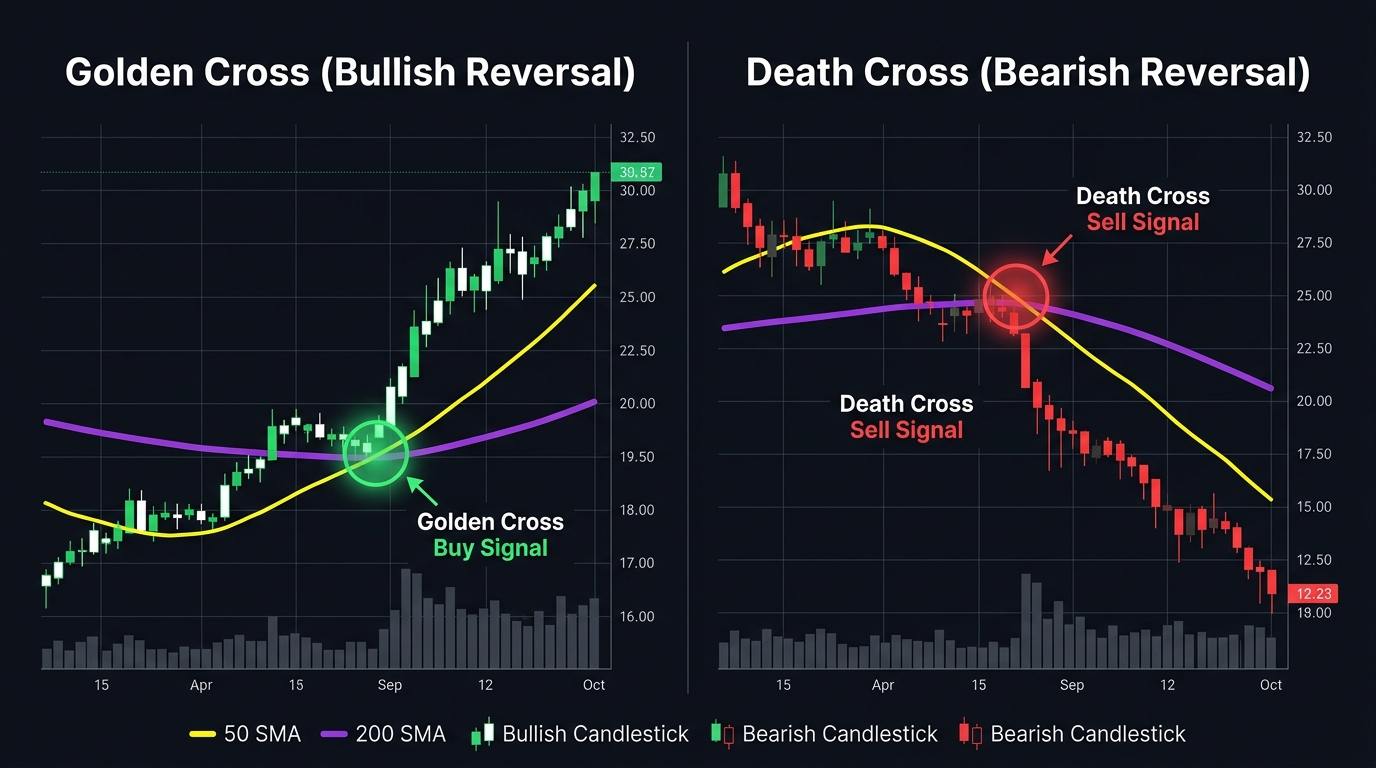
On higher timeframes, the 50/200 SMA crossover has a named variant:
- Golden Cross: 50 SMA crosses above 200 SMA — widely interpreted as a long-term bullish signal
- Death Cross: 50 SMA crosses below 200 SMA — widely interpreted as a long-term bearish signal
These signals appear monthly at most on daily charts, and are more useful as trend-direction filters than as precise entry triggers. When the Golden Cross is in effect on the daily chart, you look for long entries from lower-timeframe setups. When the Death Cross is in effect, you prioritize short entries.
Entry and Exit Rules Summary
Long Trade Setup
| Step | Action |
|---|---|
| 1. Trend filter | Daily chart shows 50 SMA above 200 SMA (Golden Cross in effect) |
| 2. Signal | Fast MA crosses above slow MA on trading timeframe |
| 3. Confirmation | Current candle closes on the far side of the slow MA |
| 4. Entry | Open long at next candle open |
| 5. Stop-loss | Below the most recent swing low before the crossover |
| 6. Take-profit | Exit on reverse crossover OR at 2x the risk distance |
Short Trade Setup
| Step | Action |
|---|---|
| 1. Trend filter | Daily chart shows 50 SMA below 200 SMA (Death Cross in effect) |
| 2. Signal | Fast MA crosses below slow MA on trading timeframe |
| 3. Confirmation | Current candle closes on the far side of the slow MA |
| 4. Entry | Open short at next candle open |
| 5. Stop-loss | Above the most recent swing high before the crossover |
| 6. Take-profit | Exit on reverse crossover OR at 2x the risk distance |
Advantages and Disadvantages
| Aspect | Detail |
|---|---|
| Advantage | Simple to implement, visual and intuitive |
| Advantage | Works well during strong trending markets and major breakouts |
| Advantage | Can be automated and backtested easily |
| Disadvantage | Lagging indicator — you always enter after the move has started |
| Disadvantage | Generates many false signals in ranging, choppy markets |
| Disadvantage | Whipsaw-prone when price oscillates around the moving average |
Filtering False Signals: The Most Important Skill
The moving average crossover system without filters produces too many false signals in ranging markets. Here are three filters that significantly improve signal quality:
Filter 1: ADX (Average Directional Index)
Only take crossover signals when ADX is above 25. ADX measures trend strength regardless of direction. Below 25 means the market is ranging — the worst environment for this strategy.
Add ADX to your chart. If a crossover occurs but ADX is below 25, skip the trade.
Filter 2: Higher Timeframe Alignment
Before entering on a 1H crossover, check the 4H chart. Is the trend on the higher timeframe consistent with your planned direction? Counter-trend crossovers on the lower timeframe (going short when 4H trend is clearly up) fail at a much higher rate.
Filter 3: Volume Confirmation
A crossover that occurs on above-average volume is more likely to follow through than one that appears on thin, low-volume price action. This is most relevant on daily charts where volume data is meaningful.
EMA vs. SMA: Which Should You Use?
| Type | Response to Price | Best For |
|---|---|---|
| SMA (Simple MA) | Slow, equal weighting | Higher timeframe trend identification |
| EMA (Exponential MA) | Fast, recent prices weighted more | Entry timing on lower timeframes |
For the strategies described above, use EMA for the fast crossover system (shorter timeframe, tighter signals) and SMA for the slow crossover system (longer timeframe, trend confirmation).
Read the full comparison in SMA vs. EMA.
Risk Management Parameters
| Parameter | Recommendation |
|---|---|
| Risk per trade | 1% of account |
| Stop-loss | Structural (swing low/high), not fixed pips |
| Minimum RR ratio | 1:2 |
| Max trades open | 2 simultaneously with this system |
| Avoid | Entering during major news events within 30 minutes |
Use the position size calculator to determine exact lot size from your stop-loss distance.
Example: EUR/USD Fast Crossover (4H Chart)
Setup: October 2024, EUR/USD on 4H chart.
- 10 EMA crosses above 25 EMA at 1.0820
- Price closes above 50 EMA at 1.0835
- ADX reads 31 (trending market confirmed)
- Daily chart shows Golden Cross in effect
Entry: Long at 1.0840 (next candle open)
Stop-loss: Below swing low at 1.0790 (50 pips)
Target: 1.0940 (100 pips, 1:2 RR)
Result: Price moves to 1.0945 over the following 4 days. Target hit.
This is the textbook setup. Not every trade looks this clean — but the filters (ADX + higher timeframe alignment) select for the better ones.
Key Takeaways
- Moving average crossovers are lagging indicators that confirm momentum shifts, not predict them
- The fast system (10/25/50 EMA) is best on 1H and 4H charts; the slow system (7/14/21 SMA) works better on 4H and Daily
- Always wait for the candle to close beyond the slow MA before entering — intrabar crossovers reverse frequently
- Filter every signal with ADX (must be above 25) and higher timeframe trend alignment
- The Golden Cross (50/200 SMA on daily) is a useful directional bias filter, not a direct entry signal
- In ranging markets, this strategy fails. Recognize choppy conditions and stand aside.
Related strategies: EMA Crossover and ADX | Three Fast EMA Crossover
Related lessons: Moving Averages | SMA vs. EMA
Tools: Position Size Calculator
Risk Disclosure & Testing
Past performance of any trading strategy is not indicative of future results. Always backtest and forward test this strategy on a free demo account before committing real financial capital.

Practice This Strategy on a Live Demo
Choose an ECN broker with tight spreads and fast execution for strategy backtesting.