Multiple Timeframe Bollinger Bands: Using Band Width Across Timeframes
Using Bollinger Bands across multiple timeframes identifies squeeze conditions that develop on higher timeframes before being traded on lower timeframes. Learn how to align daily and 4H band width for higher-probability breakout entries.
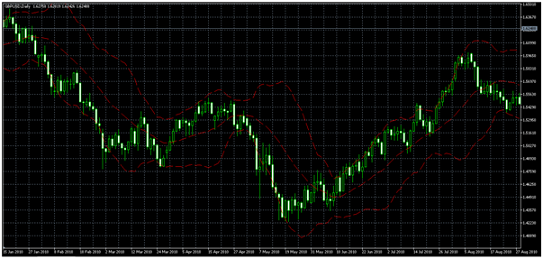
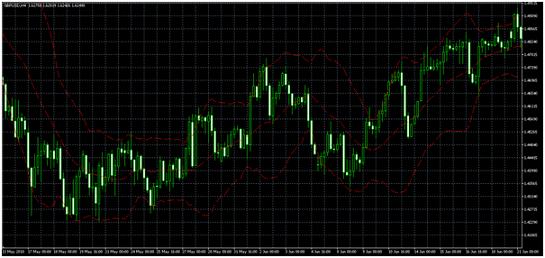
The Bollinger Band squeeze — where bands narrow to their minimum width — identifies compressed volatility before a directional move. Most traders look for squeezes on a single timeframe and enter when the bands expand.
The multiple timeframe approach improves this by requiring squeeze confirmation from a higher timeframe before acting on a lower timeframe signal. A squeeze on the daily chart that simultaneously shows a squeeze forming on the 4H chart produces a more significant setup than either alone.
The Multi-Timeframe Logic
Higher timeframe (Daily): Identifies major volatility compression — when the daily chart’s Bollinger Band Width (BBW) reaches a multi-week low, a significant directional move is building.
Lower timeframe (4H): Provides the entry timing — the 4H BBW shows its own squeeze developing or resolving. The directional break on the 4H chart is the actual entry trigger.
The alignment: When both the daily and 4H BBW are simultaneously compressed, the eventual breakout tends to be more sustained than a breakout occurring on one timeframe alone.
Setup Identification
Step 1: Find the Daily Squeeze
On the daily chart:
- Apply Bollinger Bands (20 SMA, 2 standard deviations)
- Add Bollinger Band Width indicator (BBW = (Upper - Lower) / Middle)
- Look for BBW at its lowest level in the past 3–6 months
- The bands should appear visually narrow — daily candles fitting tightly within a compressed range
What daily squeeze looks like: EUR/USD daily range shrinks from 80–100 pips to 35–50 pips over several consecutive sessions. The bands are noticeably parallel and close together.
Step 2: Confirm the 4H Squeeze
Drop to the 4H chart with the same indicator setup:
- Is the 4H BBW also at a low point?
- Are 4H candles small and overlapping (consolidation)?
Highest confidence scenario: Daily BBW at 3-month low AND 4H BBW simultaneously compressed.
Step 3: Wait for the 4H Directional Break
When both timeframes show compression:
- Watch for the first 4H candle that closes meaningfully beyond the 4H Bollinger upper or lower band
- The direction of this break establishes the trade direction
Step 4: Entry and Management
| Step | Action |
|---|---|
| Direction | Established by 4H band break (up = long; down = short) |
| Entry | Next 4H candle open after the breakout candle |
| Confirmation (optional) | MACD histogram confirms direction (green for long, red for short) |
| Stop-loss | Inside the opposite band at time of entry |
| Take-profit | 2Г— the daily ATR beyond the breakout point |
| Trailing stop | When in profit >1Г— ATR, trail stop to the 20 SMA of the 4H Bollinger Bands |
Measuring the Expected Move
After a major volatility squeeze (daily BBW at multi-month low), the subsequent move often recovers to “normal” volatility levels. The expected move size is approximately:
Expected Move ≈ Previous Average Daily Range (before compression period)Example: EUR/USD daily range compressed to 40 pips per day for 2 weeks (squeeze period). Prior to the squeeze, the daily ATR was 85 pips. The breakout move target is approximately 85–120 pips from the breakout point.
This is not a guaranteed target — it’s a probability-weighted expectation based on volatility reversion toward its historical mean.
Distinguishing a Real Squeeze From Normal Consolidation
Not every period of low volatility is a squeeze worth trading:
Genuine squeeze characteristics:
- BBW is at the lowest point in 3+ months (historical context matters)
- The compression has lasted at least 5–10 trading days (daily chart)
- Price is not trending — it’s flat-ranging within the compressed bands
Normal consolidation (not a squeeze):
- BBW is low but not historically extreme
- The “quiet period” has lasted fewer than 5 days
- Price is still making directional progress within the bands
Only trade the squeeze when BBW is historically compressed — when it’s merely “less wide than usual,” the setup doesn’t carry the same statistical significance.
Risk Management
| Parameter | Recommendation |
|---|---|
| Risk per trade | 1% of account |
| Stop | Inside the band opposite the breakout direction |
| Target | 2Г— daily ATR or prior “normal” range recovered |
| False breakout protocol | Close if price returns inside both bands within 2 candles |
| Maximum hold | 7–10 trading days if the expected ATR target isn’t reached |
Use the position size calculator.
Key Takeaways
- Multi-timeframe Bollinger Band analysis requires squeeze confirmation from the daily chart before entering on a 4H breakout signal
- The squeeze (historically low BBW on daily) signals compressed volatility; the 4H directional break provides entry timing
- The expected move after a genuine squeeze is approximately the size of the “normal” ATR before the compression began
- A genuine squeeze requires BBW at a 3+ month low with 5–10 days of compression — not just “quieter than yesterday”
- Stop goes inside the opposite band; trail to the 20 SMA when in profit; exit if price re-enters bands immediately (false breakout)
- The combination of daily squeeze + 4H confirmation produces more sustained breakouts than single-timeframe squeeze setups
Related strategies: Bollinger Bands Strategy
Related lessons: Moving Averages
Tools: Position Size Calculator
Risk Disclosure & Testing
Past performance of any trading strategy is not indicative of future results. Always backtest and forward test this strategy on a free demo account before committing real financial capital.

Practice This Strategy on a Live Demo
Choose an ECN broker with tight spreads and fast execution for strategy backtesting.