RSI and Stochastic Combined System: Two Oscillators, One Entry Signal
Combining RSI and Stochastic as a dual-confirmation oscillator system reduces false signals significantly. Learn the exact setup rules where both must align before entry, the timeframe combination, and exit rules for this two-oscillator approach.
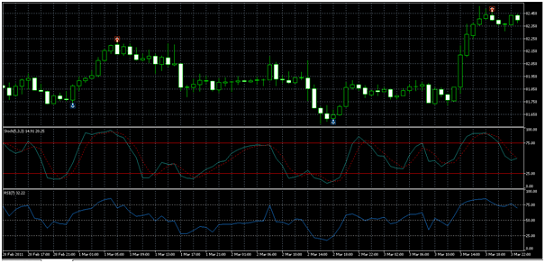
RSI and Stochastic both measure price momentum from an oscillator perspective, but they use different mathematical approaches. RSI measures the speed and magnitude of price changes over a fixed period. Stochastic measures where current price sits within the recent high-low range.
Because they derive from different calculations, when both point in the same direction simultaneously, they provide stronger confirmation than either would alone.
Why Two Oscillators Work Better Than One
Using RSI alone produces signals in trending markets that look like overbought/oversold conditions but aren’t — in a strong uptrend, RSI can sit above 70 for extended periods without a meaningful pullback occurring.
Using Stochastic alone produces many signals in ranging markets, but also generates false crossovers in trending conditions.
The combined requirement: Both RSI and Stochastic must confirm the entry signal simultaneously. This eliminates:
- Trending RSI extremes (Stochastic will often not confirm in a sustained trend)
- False Stochastic crossovers (RSI may not be in the confirming zone)
The result is fewer signals with higher per-signal quality.
Indicator Settings
| Indicator | Period | Settings |
|---|---|---|
| RSI | 14 | Overbought: 70; Oversold: 30 |
| Stochastic | 14/3/3 | Overbought: 80; Oversold: 20 |
Default settings work well on 4H and Daily charts. Adjust to 5/3/3 Stochastic for 1H day trading.
Entry Rules: Both Must Confirm
Long Entry
| Condition | RSI Requirement | Stochastic Requirement |
|---|---|---|
| Oversold zone | RSI crosses above 30 (exits oversold) | Stochastic %K crosses above %D while both below 20 |
| Timing | RSI crossover on the 4H chart | Stochastic crossover on same 4H chart |
| Candle | Same 4H candle shows both crossovers, or consecutive candles within 1–2 bars | |
| Entry | Long at next 4H candle open |
Both crossovers must occur within 1–2 candles of each other. If RSI crossed above 30 three sessions ago but Stochastic only crosses now, the signal is stale — skip.
Short Entry
| Condition | RSI Requirement | Stochastic Requirement |
|---|---|---|
| Overbought zone | RSI crosses below 70 | Stochastic %K crosses below %D while both above 80 |
| Timing | Both on the 4H chart within 1–2 candles | |
| Entry | Short at next 4H candle open |
The Trend Filter
This system generates the strongest signals when used against the prevailing trend (oversold in a downtrend pullback, overbought in an uptrend retracement). However, the most reliable variation adds a trend filter:
Using Daily 50 SMA as trend filter:
- Price above daily 50 SMA: only take long signals (both oscillators oversold and crossing up)
- Price below daily 50 SMA: only take short signals
This transforms the system from a range-trading approach to a trend-following one — enter in the trend direction when both oscillators signal a pullback is complete.
Exit Rules
Stop-loss: Below the recent swing low for long trades (10–15 pip buffer); above swing high for shorts.
Take-profit options:
| Option | Method |
|---|---|
| A — Fixed RR | 2× the stop-loss distance |
| B — Oscillator reversal | Close when both RSI reaches 50 (for longs) AND Stochastic crosses at the midpoint |
| C — Resistance target | Close at the next significant S/R level |
Option A (fixed 2:1 RR) is recommended for beginners — it removes the judgment call from exits.
When This System Underperforms
Strong trending markets: In a sustained trend, both oscillators may briefly reach the extreme zone and then continue in the trend direction without a meaningful reversal. The system produces a signal that immediately loses.
Prevention: When ADX is above 30 (strong trend), be cautious with counter-trend oscillator signals. Only take signals in the trend direction (same as the 50 SMA filter above) during high-ADX conditions.
After major news: Oscillator signals generated within 30 minutes of a major news release (NFP, FOMC) are often noise — the spike distorts both RSI and Stochastic temporarily. Wait 1–2 hours post-news before taking oscillator signals.
Risk Management
| Parameter | Value |
|---|---|
| Risk per trade | 1% of account |
| Stop-loss | Below swing low (long) or above swing high (short) |
| Take-profit | 2:1 RR minimum |
| Signal window | Both oscillators must confirm within 1–2 candles |
| ADX filter | Below 25 for range signals; above 20 for trend-following signals |
Use the position size calculator.
Key Takeaways
- Combining RSI (14, 30/70) and Stochastic (14/3/3, 20/80) as dual confirmation reduces false signals significantly compared to either alone
- Both oscillators must confirm within 1–2 candles: RSI crosses the 30/70 threshold AND Stochastic %K crosses %D in the extreme zone simultaneously
- Adding daily 50 SMA as a trend filter transforms this from range trading to trend-following: only take signals in the daily trend direction
- Exit at 2:1 fixed RR for simplicity, or wait for both oscillators to reach midpoint (50 RSI + Stochastic midzone) for a trailing approach
- Avoid signals generated immediately after major news events — oscillators distort temporarily from news spikes
- In high-ADX (above 30) trending markets, only take oscillator signals in the trend direction — counter-trend signals in strong trends are the primary failure mode
Related strategies: RSI Strategy | Stochastic Lines Crossover
Tools: Position Size Calculator
Risk Disclosure & Testing
Past performance of any trading strategy is not indicative of future results. Always backtest and forward test this strategy on a free demo account before committing real financial capital.

Practice This Strategy on a Live Demo
Choose an ECN broker with tight spreads and fast execution for strategy backtesting.