RSI Trading Strategy: How to Use the Relative Strength Index in Forex
The RSI is one of forex's most used indicators. Learn how it works, the classic overbought/oversold setups, RSI divergence as an entry signal, and how to avoid the most common RSI mistakes.
The Relative Strength Index shows up in nearly every beginner trading course and stays in most traders’ toolkits for years after. There’s a reason: when used correctly, it genuinely works. When misunderstood, it produces a reliable stream of losses at the worst possible moments.
The classic mistake is treating RSI above 70 as a sell signal and below 30 as a buy signal. That interpretation is wrong in trending markets and costs traders who follow it dearly. This lesson explains what RSI actually measures, how to use it as a meaningful entry trigger rather than a reflex, and the divergence technique that separates experienced RSI traders from beginners.
What RSI Measures
RSI (Relative Strength Index) is a momentum oscillator that measures the speed and magnitude of recent price changes. It was developed by J. Welles Wilder Jr. and introduced in his 1978 book New Concepts in Technical Trading Systems.
The indicator produces a value between 0 and 100, calculated over a default 14-period lookback:
RSI = 100 - (100 / (1 + RS))
RS = Average Gain / Average Loss (over the period)
A high RSI means recent gains have been larger and more frequent than recent losses. A low RSI means the opposite.
The standard interpretation:
- RSI above 70: Overbought territory — momentum is strong to the upside
- RSI below 30: Oversold territory — momentum is strong to the downside
- RSI at 50: Neutral; momentum is balanced
The Overbought/Oversold Problem in Trending Markets
Here is the single most important thing to understand about RSI: overbought does not mean “sell” and oversold does not mean “buy.”
In a strong uptrend, RSI can remain above 70 for weeks. Price can rise another 500 pips while RSI is “overbought.” Anyone who shorted every time RSI touched 70 during EUR/USD’s 2020–2021 uptrend paid for that misconception.
The RSI overbought/oversold levels work as reversal signals only in ranging markets. In trending markets, they are momentum confirmations — price staying overbought means the trend is healthy.
This distinction determines how you use the indicator:
| Market Condition | How to Use RSI |
|---|---|
| Strong uptrend | Use RSI > 50 to confirm long bias; dips to 40–50 are potential entries |
| Strong downtrend | Use RSI < 50 to confirm short bias; rallies to 50–60 are potential entries |
| Ranging/choppy | Use 70/30 levels as reversal signals with confirmation |
RSI Divergence: The Higher-Quality Signal
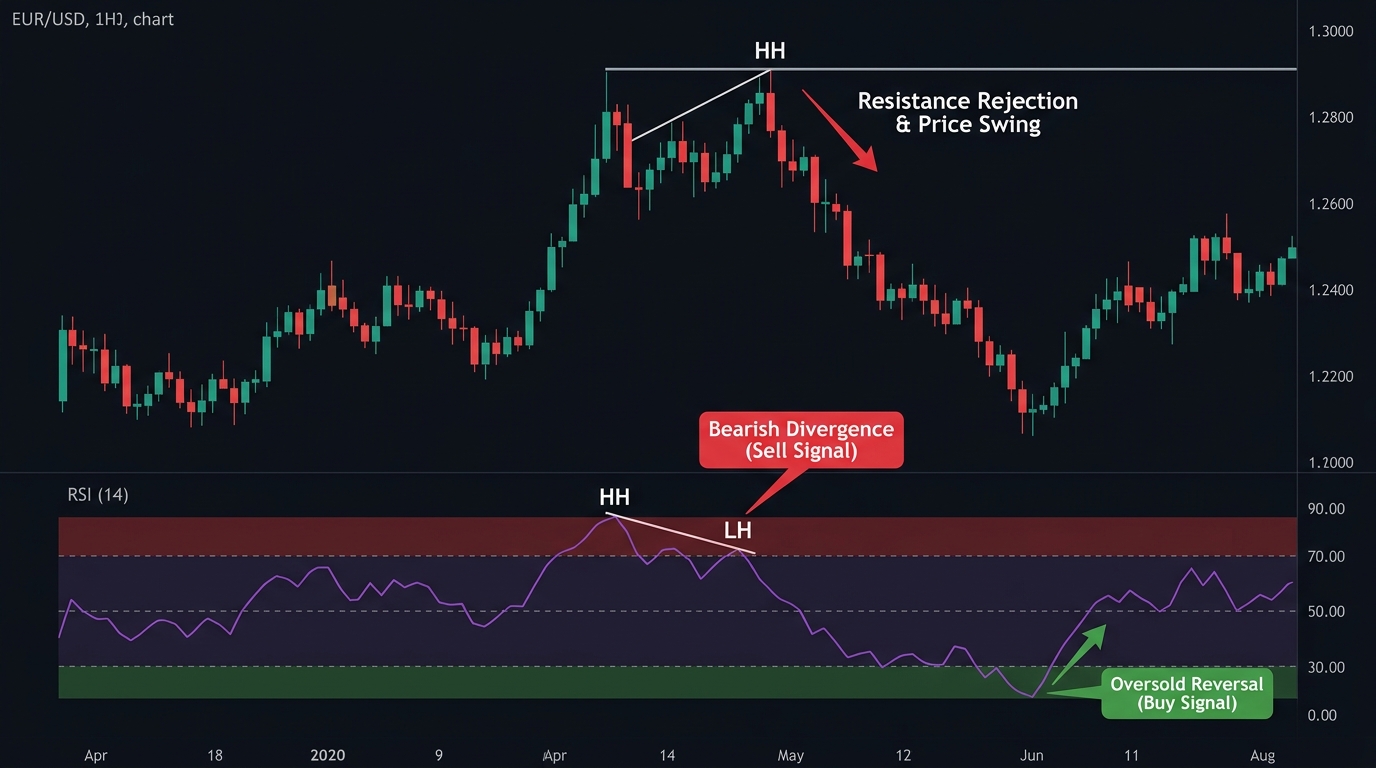
RSI divergence occurs when price makes a new high (or low) but RSI does not confirm that new extreme. This discrepancy suggests weakening momentum and is a significantly more reliable signal than the simple overbought/oversold reading.
Bearish Divergence (Potential Short Signal)
- Price makes a higher high
- RSI makes a lower high
- Interpretation: Momentum is weakening even though price is rising — potential reversal ahead
Bullish Divergence (Potential Long Signal)
- Price makes a lower low
- RSI makes a higher low
- Interpretation: Selling pressure is weakening even though price is falling — potential reversal ahead
Divergence is not an entry signal by itself. It’s a warning. You need price action confirmation — a rejection candlestick, a break of a short-term trendline, or a key support/resistance level — before entering.
Entry and Exit Rules
Setup 1: RSI Range Reversal (Range-Bound Markets)
| Step | Action |
|---|---|
| 1. Confirm ranging market | ADX below 20; price bouncing between identifiable S/R levels |
| 2. Long signal | RSI falls below 30 (oversold); look for bullish candle reversal at support |
| 3. Short signal | RSI rises above 70 (overbought); look for bearish candle reversal at resistance |
| 4. Entry | Enter on the close of the reversal confirmation candle |
| 5. Stop-loss | Below support (long) or above resistance (short) |
| 6. Take-profit | Opposite support/resistance level |
Setup 2: RSI Divergence Entry
| Step | Action |
|---|---|
| 1. Identify divergence | Price makes new extreme; RSI does not confirm |
| 2. Confirmation | Break of short-term trendline in price, OR strong reversal candlestick |
| 3. Entry | At next candle open after confirmation |
| 4. Stop-loss | Beyond the price extreme that triggered the divergence |
| 5. Take-profit | Nearest significant S/R level OR 2x risk distance |
Setup 3: RSI Mid-Line Bounce (Trending Markets)
This setup works with the trend — not against it:
| Step | Action |
|---|---|
| 1. Identify trend | Price above 200 SMA on daily chart (uptrend) OR below 200 SMA (downtrend) |
| 2. Long signal | RSI pulls back to 40–50 zone, then bounces upward |
| 3. Short signal | RSI rallies to 50–60 zone, then turns back down |
| 4. Entry | Enter after RSI confirms the bounce from the mid-line zone |
| 5. Stop-loss | Below the most recent swing low (long) or above swing high (short) |
| 6. Take-profit | Previous swing high (long) or swing low (short) |
Optimal RSI Settings
The default 14-period RSI is a reasonable starting point, but it’s not sacred:
| RSI Period | Sensitivity | Best For |
|---|---|---|
| 7 | High (more signals, more noise) | Short-term scalping/day trading |
| 14 | Medium (default) | Swing trading, general use |
| 21–25 | Low (fewer signals, cleaner) | Position trading, daily chart |
For the strategies described in this lesson, use 14-period RSI on the 4H or Daily chart as a baseline.
Combining RSI With Other Indicators
RSI works best as a confirmation tool alongside other signals:
RSI + Moving Average: Use the 200 SMA to determine trend direction. Only take RSI long signals above the 200 SMA; only take RSI short signals below it.
RSI + Support/Resistance: RSI reaching oversold levels at a key support zone is significantly more powerful than RSI at oversold in open space.
RSI + MACD: When both RSI shows divergence and MACD is crossing in the same direction, the probability of a meaningful reversal increases.
RSI + Volume: A reversal confirmed by above-average volume is more trustworthy than one on thin volume.
Risk Management Parameters
| Parameter | Recommendation |
|---|---|
| Risk per trade | 1% of account |
| Minimum RR ratio | 1:2 |
| Stop-loss | Structural (beyond key S/R), not fixed pips |
| Maximum trades | 2 simultaneously with RSI setups |
| Avoid | Entering against a strong trend (RSI divergence alone) |
Use the position size calculator to determine exact lot size from your stop-loss distance.
Common RSI Mistakes
Mistake 1: Selling just because RSI is above 70 In trending markets, RSI stays elevated. This setup produces consistent losses in trending environments.
Mistake 2: Ignoring the broader trend RSI signals against the dominant trend fail at a much higher rate. Always check the daily chart trend before acting on a lower-timeframe RSI signal.
Mistake 3: Acting on divergence without confirmation Divergence can persist for many candles before a reversal materializes. Always wait for price confirmation before entering.
Mistake 4: Using RSI alone RSI is a momentum indicator, not a complete trading system. It needs context — from the trend, support/resistance levels, and at least one confirmation signal.
RSI on Different Currency Pairs
RSI tends to work better on major pairs (EUR/USD, GBP/USD, USD/JPY) because their price action is cleaner and more technically driven. Exotic pairs and commodity currencies can show irregular RSI behavior due to lower liquidity and fundamental drivers.
Key Takeaways
- RSI measures the speed and magnitude of recent price changes on a 0–100 scale
- Overbought (>70) and oversold (<30) are not automatic entry signals — they work as reversals only in ranging markets, not trending ones
- RSI divergence (price vs. RSI making different extremes) is a higher-quality signal that suggests weakening momentum before a potential reversal
- Three valid setups: range reversal (overbought/oversold with S/R confirmation), divergence entry (with price action confirmation), and mid-line bounce (trend-following)
- Combine RSI with trend analysis, support/resistance levels, and at least one confirmation signal — never trade RSI in isolation
- Default 14-period setting is a solid starting point; adjust based on timeframe and style
Related strategies: MACD Trading System | Stochastic High Low
Related lessons: Support and Resistance Levels | Moving Averages
Tools: Position Size Calculator
Risk Disclosure & Testing
Past performance of any trading strategy is not indicative of future results. Always backtest and forward test this strategy on a free demo account before committing real financial capital.

Practice This Strategy on a Live Demo
Choose an ECN broker with tight spreads and fast execution for strategy backtesting.