Stochastic Oscillator: High-Low Strategy and Crossover Signals Explained
The Stochastic oscillator identifies overbought and oversold conditions and generates crossover signals. Learn the high-low setup, %K/%D crossover rules, divergence, and how to filter false signals in ranging and trending markets.
The Stochastic oscillator was developed by George Lane in the late 1950s and remains one of the most widely used momentum indicators in technical analysis. Unlike moving averages, it doesn’t follow price directly — it measures where the current closing price sits relative to the recent high-low range.
This distinction makes it particularly useful for identifying exhaustion points in a move: moments when price has pushed to an extreme relative to recent history and may be ready to pull back.
How the Stochastic Oscillator Works
The Stochastic produces two lines:
%K (Fast Line): The core calculation.
%K = ((Close - Lowest Low) / (Highest High - Lowest Low)) × 100Where Lowest Low and Highest High are calculated over the lookback period (default: 14).
%D (Signal Line): A smoothed average of %K (default: 3-period SMA of %K).
Both lines oscillate between 0 and 100.
Standard settings:
- %K period: 14
- %D period: 3
- Slowing: 3 (for “slow stochastic,” which is the version most traders use)
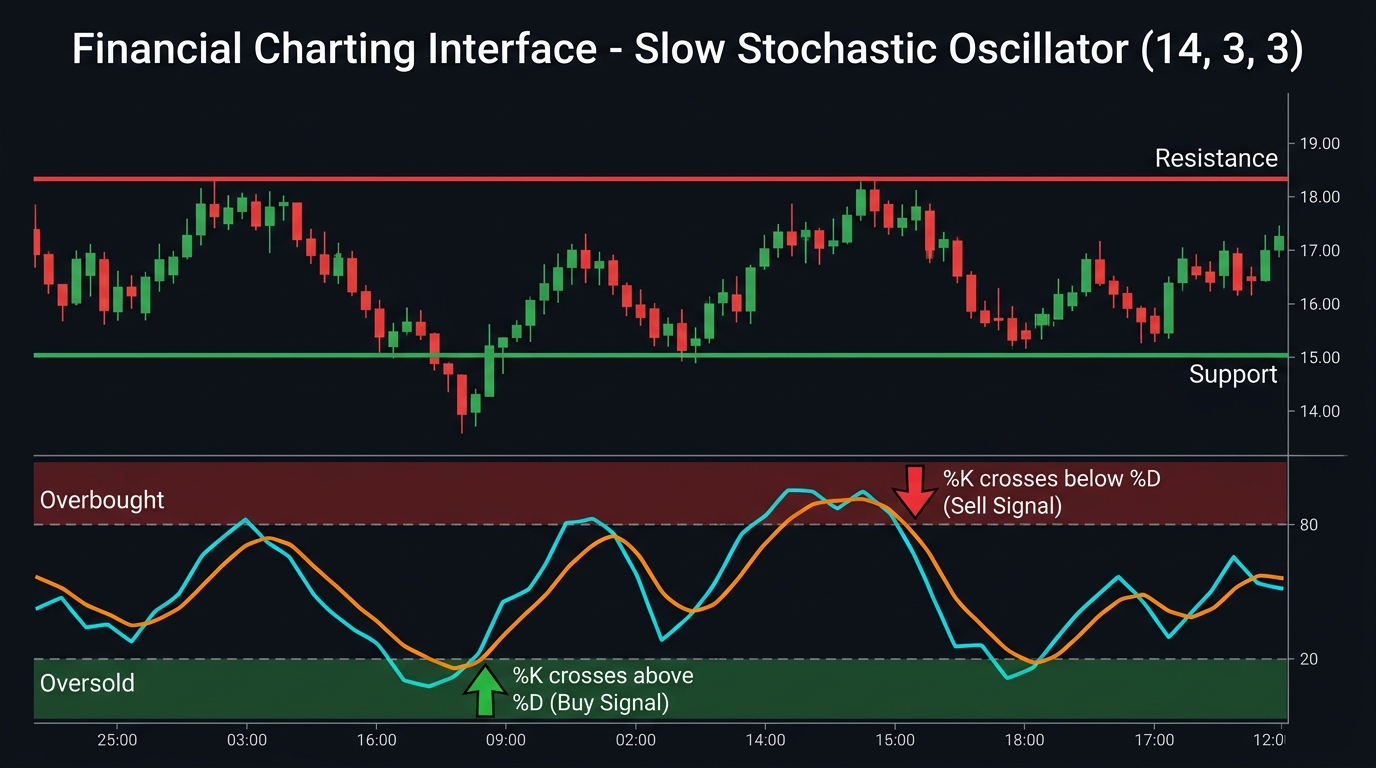
Overbought zone: Above 80 — price is closing near the top of its recent range Oversold zone: Below 20 — price is closing near the bottom of its recent range
The High-Low Strategy (Range Trading)
The most straightforward Stochastic application: buy when the oscillator signals oversold, sell when it signals overbought — within a ranging market.
Long Entry (Oversold Bounce)
| Step | Action |
|---|---|
| 1. Confirm range | Price bouncing between defined support and resistance; ADX below 20 |
| 2. Wait for signal | Stochastic %K falls below 20 (oversold) |
| 3. Confirmation | %K crosses back above %D while both lines are still below 20 |
| 4. Price action | Bullish rejection candle at or near the support zone |
| 5. Entry | Next candle open after the crossover |
| 6. Stop-loss | Below support zone (10–15 pip buffer) |
| 7. Take-profit | Upper resistance level |
Short Entry (Overbought Reversal)
| Step | Action |
|---|---|
| 1. Confirm range | Same ranging market conditions |
| 2. Wait for signal | Stochastic %K rises above 80 (overbought) |
| 3. Confirmation | %K crosses back below %D while both lines are still above 80 |
| 4. Price action | Bearish rejection candle at or near resistance zone |
| 5. Entry | Next candle open after the crossover |
| 6. Stop-loss | Above resistance zone |
| 7. Take-profit | Lower support level |
The crossover within the extreme zone (both lines in overbought or oversold territory when they cross) is significantly more reliable than a crossover occurring in the 20–80 neutral zone.
The %K/%D Crossover Strategy (Trending Markets)
In trending markets, using Stochastic overbought/oversold as reversal signals produces consistent losses. The market stays overbought for extended periods in an uptrend.
The crossover strategy adapts:
Trend-following crossover (uptrend):
- Only take long signals (ignore short signals)
- Enter when %K crosses above %D — anywhere, not just from oversold
- Additional filter: %K and %D must both be above 50 (confirming bullish momentum)
- Stop-loss: Below the most recent swing low
- Take-profit: Next resistance level or 2x risk
Trend-following crossover (downtrend):
- Only take short signals
- Enter when %K crosses below %D
- Additional filter: Both lines below 50
- Stop-loss: Above the most recent swing high
Stochastic Divergence
Like RSI, the Stochastic oscillator can produce divergence signals when price and momentum disagree.
Bullish divergence:
- Price makes a new lower low
- Stochastic makes a higher low (oscillator is not confirming the price weakness)
- Signals potential reversal upward
Bearish divergence:
- Price makes a new higher high
- Stochastic makes a lower high
- Signals potential reversal downward
Divergence is confirmed when %K crosses %D in the expected direction. Always wait for the crossover confirmation — divergence alone without the cross produces too many false entries.
Stochastic Settings Comparison
The default 14/3/3 settings work well for 4H and Daily charts. For different trading styles:
| Settings | Description | Best Timeframe |
|---|---|---|
| 5/3/3 (fast) | More signals, more noise | 15M–1H scalping |
| 14/3/3 (default) | Balanced | 4H–Daily swing trading |
| 21/5/5 (slow) | Fewer, cleaner signals | Daily–Weekly position trading |
Combining Stochastic With Other Indicators
Stochastic + RSI: When both show oversold (Stochastic below 20 AND RSI below 30) at the same time at a key support level, the combined signal carries significantly more weight than either alone.
Stochastic + Moving Average: Use a 200-period SMA on the daily chart to filter trend direction. Only take Stochastic long signals when price is above the 200 SMA; only take short signals when below.
Stochastic + Bollinger Bands: When price touches the lower Bollinger Band simultaneously with Stochastic entering oversold territory, the confluence of two separate oversold signals increases reversal probability.
Common Mistakes
Trading Stochastic signals against the trend: In a strong uptrend, the Stochastic will frequently show “overbought.” Shorting every overbought signal in an uptrend is a reliable way to accumulate losses. Always know the trend direction first.
Entering on the first cross without price confirmation: A %K/%D crossover in the extreme zone is a signal, not a guaranteed entry. Wait for a confirming candle.
Using the same settings on all timeframes: Fast settings (5/3/3) on a daily chart produce noisy, meaningless signals. Slow settings (21/5/5) on a 5-minute chart produce signals so late they’re useless. Match the settings to the timeframe.
Ignoring the broader context: The Stochastic tells you about momentum within a recent range. It doesn’t know about the macro environment, upcoming news events, or whether a support level is likely to hold.
Risk Management
| Parameter | Recommendation |
|---|---|
| Risk per trade | 1% of account |
| Stop-loss | Beyond the key S/R zone (structural, not fixed pips) |
| Minimum RR | 1:2 |
| Avoid | Trading Stochastic signals 30 minutes before/after major news |
Use the position size calculator to calculate exact lot sizes.
Key Takeaways
- The Stochastic oscillator measures where the current close sits within the recent high-low range, producing overbought (>80) and oversold (<20) signals
- The high-low strategy (fade extreme readings) works in ranging markets; the crossover strategy (trade with the trend) works in trending markets — never mix them up
- The most reliable signal: %K crosses %D while both lines are still inside the extreme zone (both below 20 for buy, both above 80 for sell)
- Divergence (price making new extreme, Stochastic not confirming) is a higher-quality reversal signal — wait for the crossover confirmation before entering
- Always determine trend direction first; Stochastic signals against a strong trend produce consistent losses
- Combine with RSI or Bollinger Bands for higher-probability confluence entries
Related strategies: RSI Strategy | Stochastic Lines Crossover
Related lessons: Support and Resistance
Tools: Position Size Calculator
Risk Disclosure & Testing
Past performance of any trading strategy is not indicative of future results. Always backtest and forward test this strategy on a free demo account before committing real financial capital.

Practice This Strategy on a Live Demo
Choose an ECN broker with tight spreads and fast execution for strategy backtesting.