Stochastic Lines Crossover Strategy: Entry Rules and Timeframe Filters
The stochastic lines crossover uses the %K and %D crossover as an entry trigger for both trend-following and counter-trend trades. Learn the specific conditions, filters, and timeframe combinations that make this signal reliable.
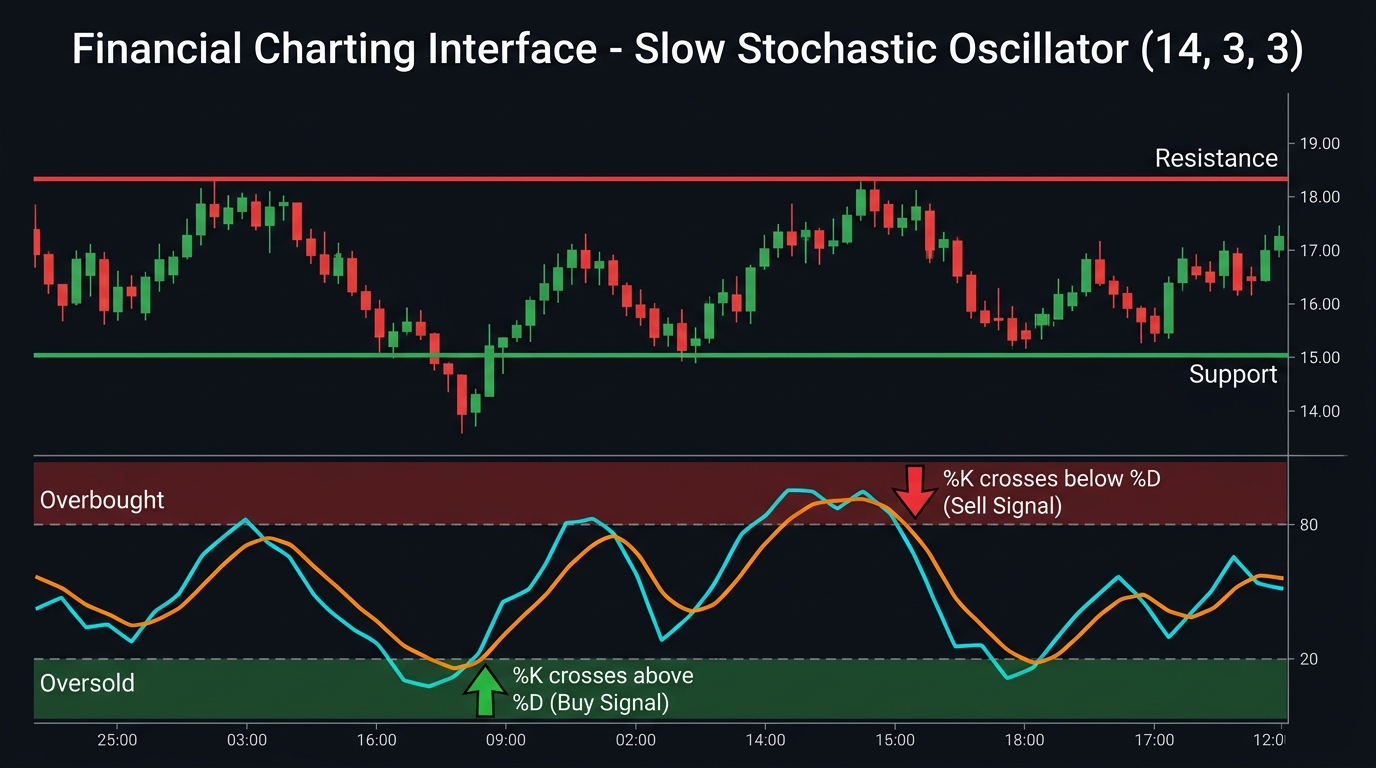
The stochastic oscillator generates its most actionable signal when the fast %K line crosses the slow %D line. This crossover, when filtered correctly, provides a mechanical entry trigger for both trend-following and range-reversal trades.
The key word is “filtered.” The raw stochastic crossover generates too many signals to be traded profitably without additional conditions. This lesson specifies exactly which crossovers to take, under which market conditions, and on which timeframes.
The %K/%D Crossover: What It Means
The stochastic oscillator plots two lines:
- %K (fast line): Measures where current price sits within the recent high-low range
- %D (signal line): A 3-period smoothing of %K
When %K crosses above %D, recent prices are rising relative to the period’s range — a bullish momentum shift. When %K crosses below %D, the reverse.
The problem with all crossovers: They occur constantly. In a ranging market, %K and %D cross dozens of times per week. Without filters, this produces constant whipsaw.
The solution: Specify exact conditions that must be present before any crossover is taken.
Filter Framework
Before any stochastic crossover entry, all of the following must be checked:
| Filter | Bullish Entry Requirement | Bearish Entry Requirement |
|---|---|---|
| Trend | Daily 50 SMA sloping up; price above it | Daily 50 SMA sloping down; price below it |
| ADX | ADX (14) above 20 on 4H chart | ADX (14) above 20 on 4H chart |
| Crossover zone | Both %K and %D below 50 (pullback territory) | Both %K and %D above 50 (rebound territory) |
| Crossover direction | %K crosses above %D | %K crosses below %D |
| Candle | 4H candle closes with crossover confirmed | Same |
The “crossover zone” filter is critical: crossovers that occur when both lines are in the correct half of the indicator (below 50 for longs, above 50 for shorts) align with the trend. Crossovers in the opposite half are counter-trend signals with lower probability.
System 1: Trend-Following Stochastic Crossover (Primary Strategy)
Setup conditions for long entry:
| Condition | Requirement |
|---|---|
| Daily trend | Price above daily 50 SMA (uptrend) |
| 4H ADX | Above 20 |
| 4H stochastic | Both %K and %D pulled back below 50; %K crosses above %D |
| Candle confirmation | Current 4H candle closes with crossover intact |
| Entry | Long at next 4H candle open |
| Stop-loss | Below the most recent 4H swing low |
| Take-profit | Previous 4H swing high, or 2× risk distance |
Setup conditions for short entry:
| Condition | Requirement |
|---|---|
| Daily trend | Price below daily 50 SMA (downtrend) |
| 4H ADX | Above 20 |
| 4H stochastic | Both %K and %D rebounded above 50; %K crosses below %D |
| Candle confirmation | Current 4H candle closes with crossover intact |
| Entry | Short at next 4H candle open |
| Stop-loss | Above the most recent 4H swing high |
| Take-profit | Previous 4H swing low, or 2× risk distance |
System 2: Range Reversal Crossover (Secondary Strategy)
In ranging conditions (ADX below 20, price oscillating between defined S/R), the stochastic crossover from extreme zones produces reliable reversal entries.
Long entry (oversold crossover):
| Condition | Requirement |
|---|---|
| Market | Defined range; ADX below 20 |
| Location | Price at or near the range’s support zone |
| Stochastic | Both %K and %D in oversold zone (below 20) |
| Crossover | %K crosses above %D while both below 20 |
| Entry | Long at next candle open |
| Stop-loss | Below the support zone (15–20 pip buffer) |
| Take-profit | Range midpoint or upper resistance |
Short entry (overbought crossover):
Mirror conditions: ADX below 20, price at resistance, both lines above 80, %K crosses below %D.
Timeframe Combinations
Using multiple timeframes improves signal quality significantly:
| Higher Timeframe | Trading Timeframe | Application |
|---|---|---|
| Daily | 4H | System 1 (trend-following) |
| 4H | 1H | Faster signals; more trades |
| Weekly | Daily | Position trading setups |
Multi-timeframe example:
- Daily chart shows uptrend (price above 50 SMA daily)
- 4H stochastic pulls back below 50; %K crosses above %D → 4H long signal
- Drop to 1H: wait for the 1H stochastic to also show a bullish crossover from below 50
- Enter long on the 1H setup with the 4H and daily trends aligned
The requirement for alignment across two or three timeframes reduces signal frequency but significantly increases the win rate per signal.
Settings for Different Strategies
| Settings | Type | Best For |
|---|---|---|
| 5/3/3 | Fast stochastic | 1H day trading; frequent signals |
| 14/3/3 | Default | 4H swing trading |
| 21/5/5 | Slow stochastic | Daily chart position trades |
Note on “fast” vs. “slow” stochastic: The “slow” stochastic (default in most platforms) has already smoothed the raw %K. The “fast” stochastic uses the unsmoothed %K. For most traders, the slow (default) stochastic is preferable — the raw %K creates excessive noise.
Example: USD/JPY 4H, March 2025
Setup: USD/JPY in an established downtrend. Daily 50 SMA sloping down; price below it.
Signal: On 4H chart:
- Stochastic rebounded from below 20 to above 50 during a correction
- Both %K and %D are above 50; ADX at 28 (trending)
- %K crosses below %D at 63/60 level
- 4H candle closes bearish confirming the cross
Entry: Short at 149.45 (next 4H candle open)
Stop-loss: Above swing high at 150.20 (75 pips)
Take-profit: 147.95 (150 pips, 1:2 RR)
Outcome: USD/JPY declines to 147.80 over the following 5 days. Target exceeded.
Risk Management
| Parameter | Value |
|---|---|
| Risk per trade | 1% of account |
| Minimum RR | 1:2 |
| Stop-loss | Structural swing high/low |
| Maximum trades | 2 simultaneously with this system |
| Avoid | Trading stochastic crossovers during major news events |
Use the position size calculator.
Key Takeaways
- The stochastic %K/%D crossover generates far too many signals without filters; the trend direction, ADX level, and crossover zone are all required filters
- System 1 (trend-following): crossovers from the correct half of the indicator (below 50 for longs in an uptrend, above 50 for shorts in a downtrend) aligned with the daily 50 SMA direction
- System 2 (range reversal): crossovers from extreme zones (below 20 for longs, above 80 for shorts) in confirmed ranging conditions (ADX <20)
- Multi-timeframe confirmation (4H signal + daily trend) significantly improves win rate per trade
- Use 14/3/3 settings for 4H swing trading; adjust down (5/3/3) for day trading, up (21/5/5) for position trading
Related strategies: Stochastic High Low | RSI Strategy
Tools: Position Size Calculator
Risk Disclosure & Testing
Past performance of any trading strategy is not indicative of future results. Always backtest and forward test this strategy on a free demo account before committing real financial capital.

Practice This Strategy on a Live Demo
Choose an ECN broker with tight spreads and fast execution for strategy backtesting.