Support and Resistance Indicators: Which Tools Identify Levels Most Reliably
Several technical indicators specifically help identify support and resistance levels. Learn how Bollinger Bands, pivot points, Fibonacci, and the Donchian Channel function as S/R identification tools and when each is most effective.
Price structure (swing highs/lows and consolidation zones) provides the primary support and resistance framework. Indicators can extend that framework by identifying additional dynamic or calculated levels. The key is understanding what each tool calculates so you know when its levels are meaningful and when they’re not.
Bollinger Bands as Dynamic S/R
What they measure: The upper and lower bands sit at 2 standard deviations from the 20-period moving average. Statistically, approximately 95% of price action falls within these bands under normal conditions.
S/R application:
- Upper band: Dynamic resistance in ranging conditions; price touching it indicates a statistically extended move upward
- Lower band: Dynamic support in ranging conditions; extended downside move
When Bollinger Bands work as S/R:
- In ranging markets (ADX below 20): price oscillates between the upper and lower bands, which function as ceiling and floor
- Combined with a rejection candlestick at the band
When they don’t work:
- In trending markets: price can “walk” the upper band for extended periods — the upper band is not resistance, it’s the edge of the trend
- During high-volatility events: the bands expand rapidly and price breaks beyond them without meaningful S/R significance
Pivot Points as Calculated S/R
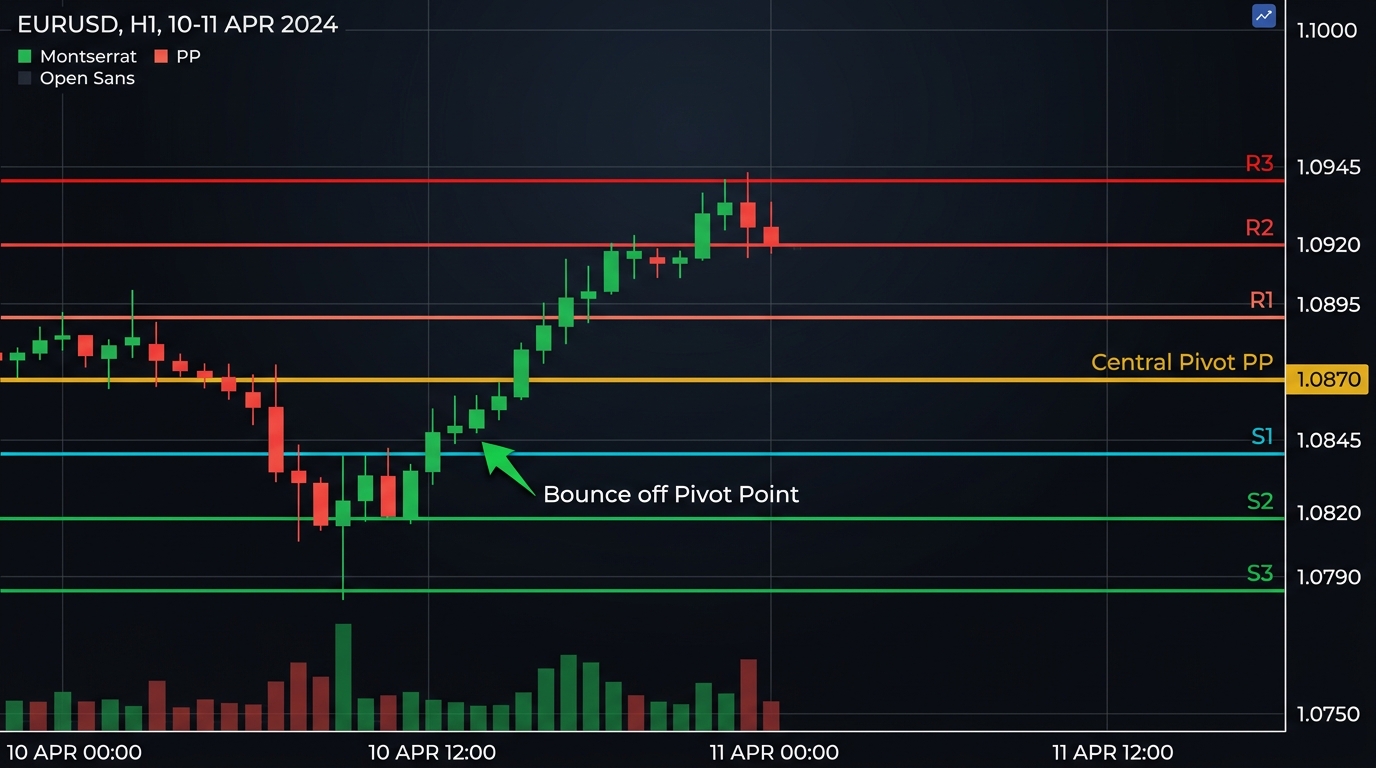
What they measure: The arithmetic mean of the previous period’s high, low, and close, with projected support and resistance levels above and below.
S/R application: S1, S2 (support), R1, R2 (resistance) are the key levels. They represent calculated levels where institutional trading algorithms expect price to encounter order flow.
When pivot points work as S/R:
- During active sessions (London, NY) for major pairs: the concentration of algorithmic and institutional order placement makes these levels self-fulfilling
- On the first or second touch of a level in a session
When they become less reliable:
- After a Tier 1 news event creates a large gap from the calculated levels (the market has repriced beyond the normal session range)
- In the Asian session for EUR/USD/GBP pairs: lower liquidity reduces the significance of the pivot levels
For complete pivot methodology, see Pivot Points Trading.
Fibonacci Levels as S/R
What they measure: Specific ratios (38.2%, 50%, 61.8%, 78.6%) of a completed price move, projected horizontally as potential retracement support or resistance.
S/R application: When price retraces a prior move, the Fibonacci levels indicate where the retracement is likely to find support (in an uptrend) or resistance (in a downtrend).
When Fibonacci works as S/R:
- After a clearly identifiable directional move (not during) — the Fibonacci is drawn from a clear A-to-B move
- At the 61.8% level specifically: the most widely watched Fibonacci ratio, attracting the most order concentration
- In combination with other S/R (a Fibonacci 61.8% at the same price as a previous swing low is a high-conviction zone)
When Fibonacci doesn’t work:
- When drawn from arbitrary points rather than clear swing highs/lows
- In very choppy markets without clear directional swings to measure
For complete Fibonacci guidance, see Fibonacci Retracement.
Donchian Channel as Dynamic S/R
What it measures: The highest high and lowest low over a specified period (commonly 20 periods). Appears as a channel on the chart.
S/R application:
- Upper channel: The highest price in the last 20 periods — a resistance reference that adapts as price makes new highs
- Lower channel: The lowest price — a dynamic support floor
- Channel middle: (Upper + Lower) / 2 — a midpoint reference similar to the 20-period median
When useful: As a breakout trigger — when price closes above the Donchian upper channel, it’s setting a 20-period high, potentially signaling a new trend. This is the logic behind the original Turtle Trading system.
Settings: 20-period for swing trading; 10-period for shorter-term signals.
Choosing the Right Indicator-Based S/R Tool
| Tool | Best Conditions | Key Weakness |
|---|---|---|
| Bollinger Bands | Ranging markets; ADX < 20 | Fails during strong trends |
| Pivot Points | Active sessions (London/NY) | Less reliable after major news |
| Fibonacci | After clear directional moves | Arbitrary application is common |
| Donchian Channel | Breakout identification | Lagging; not a reversal tool |
The principle of confluence remains paramount: An indicator-based S/R level that coincides with a structural level (swing high/low or consolidation zone) is significantly more reliable than any indicator level standing alone.
Key Takeaways
- Four indicator-based S/R tools: Bollinger Bands (dynamic; ranging markets), Pivot Points (calculated; institutional reference), Fibonacci (measured; post-move retracements), Donchian Channel (historical range; breakout tool)
- Each tool works under specific conditions — knowing when to use each is more important than knowing the calculation
- Bollinger Bands work as S/R in ranging markets; in trending markets they’re trend reference points, not S/R levels
- Fibonacci 61.8% is the most reliable single Fibonacci level; it attracts the greatest institutional order concentration
- Always prefer indicator-based S/R that coincides with structural S/R (swing highs/lows, consolidation zones) — confluence from two different methods creates stronger levels
- None of these tools generates buy or sell signals by themselves — they identify zones where price action signals (rejection candles, breakouts) become actionable
Related: Support and Resistance Levels | Methods to Establish S/R | Fibonacci Retracement
Risk Disclosure & Testing
Past performance of any trading strategy is not indicative of future results. Always backtest and forward test this strategy on a free demo account before committing real financial capital.

Practice This Strategy on a Live Demo
Choose an ECN broker with tight spreads and fast execution for strategy backtesting.