Trend Indicators in Forex: A Complete Guide to Reading Market Direction
Trend indicators are the core of directional trading. Learn how Moving Averages, ADX, Parabolic SAR, and Ichimoku Cloud work, when to use each, and how to combine them for a reliable trend-following system.
Trend following is the oldest and most consistently profitable approach to financial markets. The principle is simple: identify the direction of the dominant trend, trade in that direction, and avoid fighting it. The difficulty is execution — specifically, choosing and correctly applying the indicators that give you the most reliable trend information.
This guide covers the four most important trend indicators used in forex, how each one works, its specific strengths and weaknesses, and how to combine them into a coherent trend-following system.
Why Trend Indicators Matter
Approximately 70% of the time, forex markets are in some form of trending or directional bias. The remaining 30% is ranging or consolidation. Trading trend indicators in the wrong market condition (a range) produces consistent losses. Using them correctly in trending conditions produces consistent wins.
The fundamental challenge: no single indicator tells you definitively whether you’re in a trend or a range. That’s why combining 2–3 indicators that measure different aspects of price action produces more reliable results than relying on any one.
Indicator 1: Moving Averages (MA)
What it measures: The average price over a defined period. Smooths out noise to reveal the underlying direction.
Types:
- SMA (Simple Moving Average): Equal weight to all periods. Slower, cleaner. Best for trend identification.
- EMA (Exponential Moving Average): More weight on recent periods. Faster, more responsive. Best for entry timing.
How to use MAs for trend direction:
| Configuration | Signal |
|---|---|
| Price above 200 SMA | Long-term uptrend |
| Price below 200 SMA | Long-term downtrend |
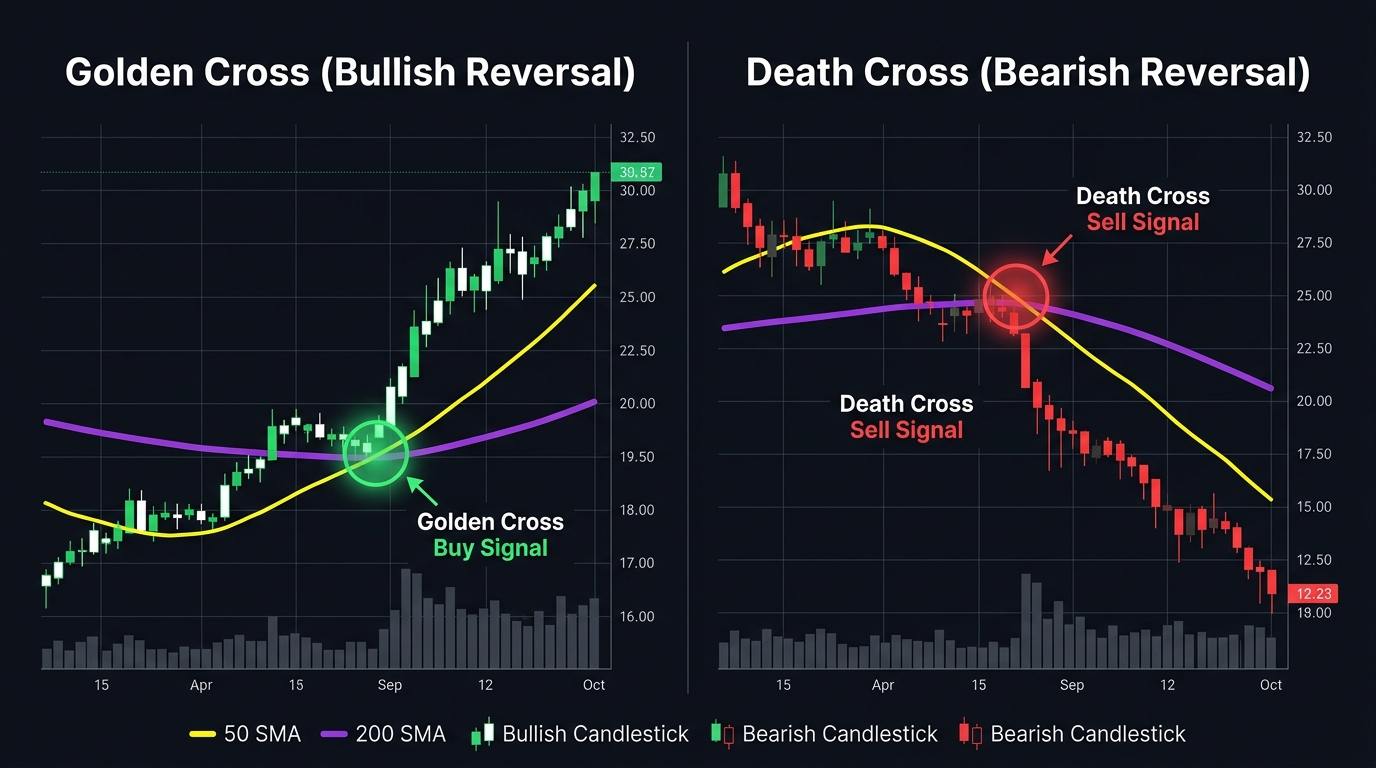
| 50 SMA above 200 SMA (Golden Cross) | Bullish trend shift |
| 50 SMA below 200 SMA (Death Cross) | Bearish trend shift |
| Price above 20 EMA and 50 EMA | Short-term uptrend intact |
| Price below 20 EMA and 50 EMA | Short-term downtrend intact |
Limitation: Moving averages are lagging — they confirm trends after they’ve begun, not before. They also generate false signals in ranging markets where price oscillates around the moving average.
Best timeframe: Daily and 4H for trend identification. 1H for entry timing.
Indicator 2: ADX (Average Directional Index)
What it measures: The strength of a trend, not its direction. ADX ranges from 0 to 100 and measures whether the market is trending at all.
The ADX is accompanied by two directional lines:
- +DI (Positive Directional Indicator): Measures upward movement strength
- -DI (Negative Directional Indicator): Measures downward movement strength
ADX reading interpretation:
| ADX Value | Trend Strength |
|---|---|
| 0–20 | No trend / ranging market |
| 20–25 | Trend beginning to form |
| 25–35 | Moderate trend — tradeable |
| 35–50 | Strong trend |
| 50+ | Very strong trend (rare, often near exhaustion) |
How to use ADX:
Trend confirmation: If ADX is above 25, the market is trending. This is the green light to use trend-following strategies. If ADX is below 20, avoid trend-following setups and switch to range strategies.
Directional signal: When +DI crosses above -DI (with ADX above 25), price is in an uptrend. When -DI crosses above +DI, price is in a downtrend.
Limitation: ADX is also a lagging indicator. It confirms that a trend exists but cannot tell you how much longer it will last. A very high ADX (50+) can signal that a trend is nearing exhaustion, but this is not reliable for timing exits.
Indicator 3: Parabolic SAR (Stop and Reverse)
What it measures: Dynamic stop-loss and trailing stop levels based on price movement. The Parabolic SAR appears as dots above or below price candles.
- Dots below price: Uptrend signal — SAR acts as a trailing stop for long positions
- Dots above price: Downtrend signal — SAR acts as a trailing stop for short positions
When price crosses the SAR dots (dots flip from below to above, or vice versa), the signal is to close the current position and potentially open one in the opposite direction.
How to use Parabolic SAR:
| Signal | Interpretation | Action |
|---|---|---|
| Dots flip to below price | Potential uptrend beginning | Enter long / close short |
| Dots flip to above price | Potential downtrend beginning | Enter short / close long |
| Dots moving rapidly away from price | Strong trend, SAR accelerating | Hold position; manage trailing stop |
| Dots close to price | Trend losing momentum | Prepare for potential flip |
Key application: Many traders use PSAR not as an entry signal but as a trailing stop for existing positions. Once in a long trade, the PSAR level below price tells you where to move your stop-loss as the trend continues.
Settings: Default acceleration factor 0.02, maximum 0.2. These can be adjusted — a lower acceleration factor produces fewer, wider signals; a higher value produces tighter, more sensitive stops.
Limitation: In ranging or choppy markets, PSAR “flips” frequently, producing many false signals. Always confirm the trend exists (ADX above 25) before relying on PSAR for directional signals.
Indicator 4: Ichimoku Cloud (Ichimoku Kinko Hyo)
What it measures: The Ichimoku is a complete trend-following system in one indicator. It identifies trend direction, support/resistance levels, and momentum simultaneously.
The five components:
| Line | Calculation | What It Shows |
|---|---|---|
| Tenkan-sen (Conversion) | (9H + 9L) / 2 | Short-term momentum |
| Kijun-sen (Base) | (26H + 26L) / 2 | Medium-term trend |
| Senkou Span A (Leading A) | (Tenkan + Kijun) / 2, 26 periods ahead | Upper/lower cloud boundary |
| Senkou Span B (Leading B) | (52H + 52L) / 2, 26 periods ahead | Other cloud boundary |
| Chikou Span (Lagging) | Close, 26 periods back | Momentum confirmation |
The Cloud (Kumo): The shaded area between Senkou Span A and B. This is the most visually distinctive and practically useful component:
- Price above the cloud → uptrend
- Price below the cloud → downtrend
- Price inside the cloud → consolidation / indecision
- Thick cloud = strong support/resistance; thin cloud = weak support/resistance
Simplified Ichimoku rules for beginners:
- Only take long setups when price is above the cloud
- Only take short setups when price is below the cloud
- The TK Cross (Tenkan crossing above/below Kijun) is the entry signal
- Use the Kijun-sen as a trailing stop
Limitation: Ichimoku was designed for daily charts and the Japanese session. It requires careful timeframe matching — using it on 5-minute charts produces unreliable results for most traders.
Building a Trend-Following System With Multiple Indicators
No single indicator is sufficient. A practical combination:
Tier 1 — Trend identification (Weekly/Daily):
- 200 SMA above/below price = long-term directional bias
- Ichimoku Cloud position confirms broad trend
Tier 2 — Trend confirmation (4H):
- ADX above 25 = trend is strong enough to trade
- +DI/-DI direction matches the daily bias
- Price above/below key EMAs (50, 200)
Tier 3 — Entry timing (1H):
- Parabolic SAR flip in the trend direction
- Or: Fast/slow EMA crossover in the trend direction
- Price action confirmation (rejection candle at dynamic support)
Stop-loss: Parabolic SAR level or below key EMA (whichever is further from entry)
Exit: When Tier 2 or Tier 3 confirms reversal, or when ADX drops below 20 (trend fading)
When Trend Indicators Fail
Even the best trend indicators produce false signals during:
- Economic news events — sudden price spikes can trigger false indicator signals that resolve within hours
- Market open/close transitions — thin liquidity at session transitions creates artificial moves
- Consolidation before major breakouts — price is about to trend, but hasn’t started; indicators look bearish/bullish alternately
The solution: always check the ADX first. Below 20 means no trend indicators should be trusted for directional entries.
Key Takeaways
- The four core trend indicators: Moving Averages (direction and slope), ADX (trend strength), Parabolic SAR (dynamic stops and flip signals), Ichimoku (complete trend system)
- ADX is the most important filter: only apply trend indicators when ADX is above 25. Below 20, switch to range strategies.
- Moving averages work best for trend identification (200 SMA daily); EMAs work best for entry timing (20/50 EMA on 4H)
- Parabolic SAR is particularly effective as a trailing stop mechanism for existing trend positions
- Ichimoku Cloud provides immediate visual context for trend direction — price above cloud = uptrend, below = downtrend
- Layer indicators: identify on daily (200 SMA + Ichimoku), confirm on 4H (ADX + EMAs), time entry on 1H (PSAR or EMA crossover)
Related strategies: EMA Crossover and ADX | PSAR and MACD on EUR/USD
Related lessons: Moving Averages | SMA vs. EMA | Trends Explained
Tools: Position Size Calculator
Risk Disclosure & Testing
Past performance of any trading strategy is not indicative of future results. Always backtest and forward test this strategy on a free demo account before committing real financial capital.

Practice This Strategy on a Live Demo
Choose an ECN broker with tight spreads and fast execution for strategy backtesting.