Volatility Indicators: ATR, Bollinger Bands, and Standard Deviation in Forex
Volatility indicators measure how much price is moving — not which direction. Learn how ATR, Bollinger Bands, and Standard Deviation measure volatility, what extreme readings signal, and how to apply volatility data to position sizing and stop placement.
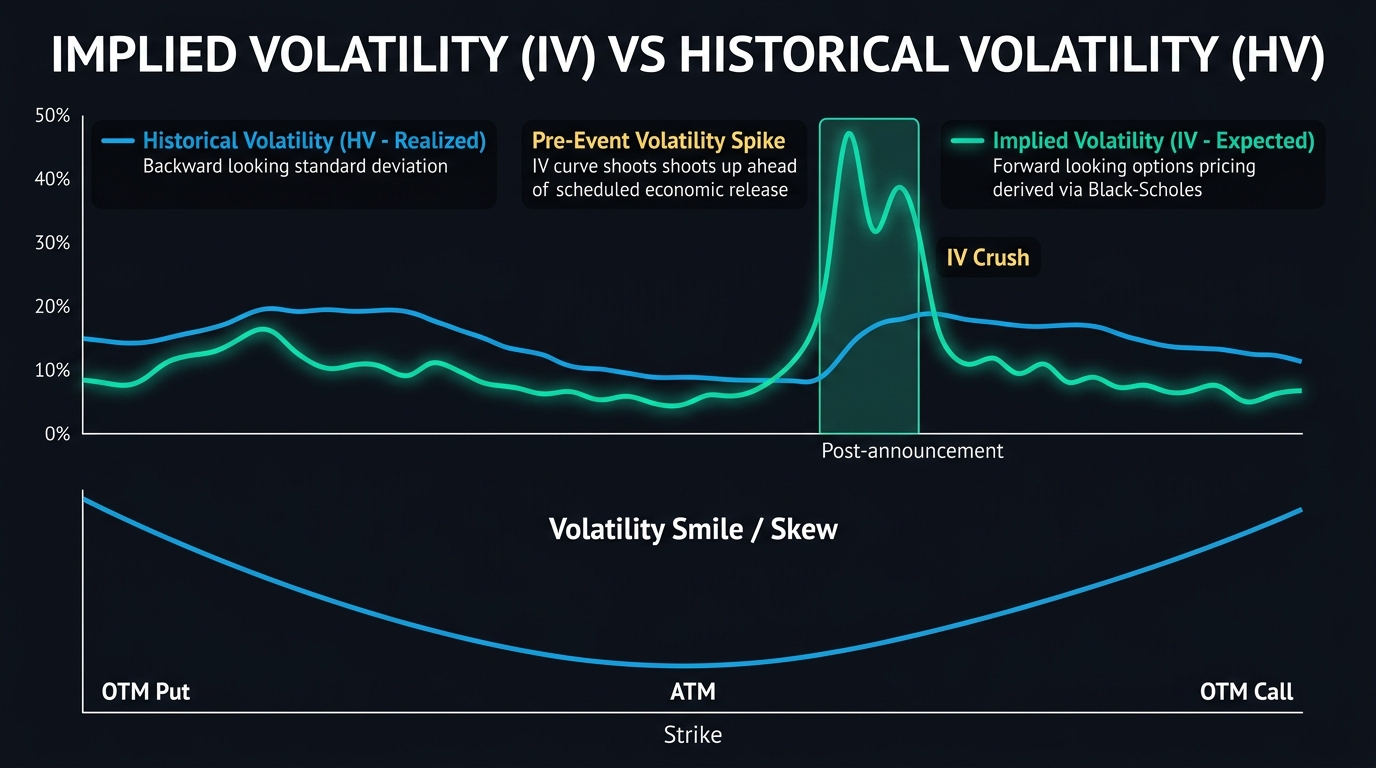
Volatility indicators measure how much price is moving within a given period — the amplitude of price swings, not the direction. They answer the question: “How wild is this market right now?”
This information is essential for two specific applications: stop-loss calibration (stops should be wider when volatility is high) and opportunity identification (low volatility precedes high volatility moves — the squeeze setup).
ATR (Average True Range)
What it measures: The average of the “true range” — the largest of: (high − low), (high − previous close), or (previous close − low) — over a specified period. This captures gaps and after-hours moves that a simple high-low range would miss.
Output: A value in pips (for forex). If EUR/USD ATR (14) shows 85, the average daily range over the last 14 days is 85 pips.
Applications:
- Stop-loss sizing: Use 1.5× ATR as the stop distance for swing trades (see Volatility Stop-Loss lesson)
- Target sizing: If ATR is 85 pips and your stop is 60 pips, a 1:1.5 RR target would be approximately 90 pips — reasonable relative to the daily range
- Trade timing: An ATR reading much higher than the daily norm (e.g., ATR of 150 when the 1-month average is 85) signals extraordinary volatility — likely a news event aftermath; reduce position size or wait for ATR to normalize
Settings: 14-period is the most common. 7-period for shorter-term sensitivity; 20-period for smoothed long-term volatility reference.
ATR does not provide directional signals. It only tells you how much price is moving. A high ATR in a downtrend just means the downtrend is moving fast — it doesn’t signal reversal.
Bollinger Band Width (BBW)
What it measures: The distance between the upper and lower Bollinger Bands relative to the middle band:
BBW = (Upper Band − Lower Band) / Middle BandA high BBW means the bands are wide (high recent volatility). A low BBW means the bands are narrow (low recent volatility — the squeeze).
Applications:
- Squeeze identification: When BBW reaches its lowest point in 3+ months, the Bollinger Band Squeeze setup is forming — a significant directional move is likely approaching
- Breakout confirmation: If price breaks beyond the upper band AND BBW is expanding rapidly, the breakout is in a genuine increasing volatility context (more reliable than a breakout with static BBW)
- Ranging market confirmation: A stable, low BBW that isn’t declining further signals a stable range — valid for range trading
The squeeze signal: When BBW is at a multi-month low, price is historically compressed. Past behavior consistently shows that low-volatility periods are followed by high-volatility periods — the direction of the high-volatility period is what the squeeze breakout trade captures.
For complete squeeze strategy, see Bollinger Bands Strategy.
Standard Deviation
What it measures: The statistical dispersion of price from its mean over a specified period. Bollinger Bands are literally 2 standard deviations from the 20-period mean — so Bollinger Bands are a visualization of standard deviation.
Some traders use the Standard Deviation indicator directly (without the Bollinger Bands visual) to monitor:
- Rising standard deviation: volatility expanding
- Falling standard deviation: volatility compressing
- Spike in standard deviation: unusual price movement (news event or trend acceleration)
In practice, Bollinger Band Width conveys the same information more intuitively. Most traders use BBW rather than raw Standard Deviation unless they’re building quantitative systems.
Comparing Volatility Indicators
| Indicator | Output | Primary Use | Limitation |
|---|---|---|---|
| ATR | Pips of average range | Stop sizing; position calibration | No directional info |
| Bollinger Band Width | Ratio (dimensionless) | Squeeze identification; range vs. trend | Requires BB setup |
| Standard Deviation | Statistical measure | Same as BBW; quantitative systems | Less intuitive |
Applying Volatility Data to Trading Decisions
Before every trade, check ATR:
- What is the current ATR for this pair on this timeframe?
- Is my stop-loss at least 1× ATR from entry? (If not, it will be hit by normal daily noise)
- Does my target represent a reasonable multiple of ATR?
When ATR spikes significantly (>2× normal):
- Reduce position sizes by 50% (same dollar risk requires smaller lots when stops are wider)
- Widen stops to match the elevated volatility
- Consider waiting 1–2 sessions for volatility to normalize before entering new positions
When BBW is at a multi-month low:
- A squeeze setup may be forming — watch for the directional break
- Don’t trade range bounces between the bands with high conviction — the range may be about to end dramatically
- Reduce position sizes until direction is confirmed
Key Takeaways
- Volatility indicators measure price amplitude, not direction — they inform stop sizing and opportunity identification, not trade direction
- ATR provides stop-loss calibration: use 1.5× ATR as the stop distance for swing trades; reduce position size when ATR spikes
- Bollinger Band Width identifies squeeze conditions (multi-month low BBW = compressed volatility before a major move)
- High ATR (>2× normal) signals extraordinary volatility — reduce position sizes proportionally and widen stops
- Standard Deviation and BBW measure the same thing — BBW is the more practical visual tool for most traders
- None of these indicators generate directional signals; combine with trend indicators (SMA, EMA) and oscillators (RSI, Stochastic) for complete analysis
Related lessons: Average True Range | Volatility Stop-Loss
Related strategies: Bollinger Bands Strategy
Risk Disclosure & Testing
Past performance of any trading strategy is not indicative of future results. Always backtest and forward test this strategy on a free demo account before committing real financial capital.

Practice This Strategy on a Live Demo
Choose an ECN broker with tight spreads and fast execution for strategy backtesting.