Base period
A designated historical reference point in time against which subsequent economic, financial, or statistical data series are normalized to evaluate relative rate-of-change and structural trends.
What is a Base Period?
A base period is an established historical point in time, reference month, or multi-year span chosen as the benchmark against which future economic indicators, price indices, corporate budgets, or statistical measurements are compared. In quantitative statistics, the base period is assigned an arbitrary numerical baseline value, typically 100 or 1,000, simplifying complex multi-variable time series into standardized index numbers.
By indexing time series against a consistent base period, economists, institutional traders, and corporate controllers can isolate relative rates of change from absolute currency units. Tracking whether consumer prices have increased by 210% over four decades or whether industrial output has expanded by 15% across an economic cycle requires establishing a stable starting anchor.
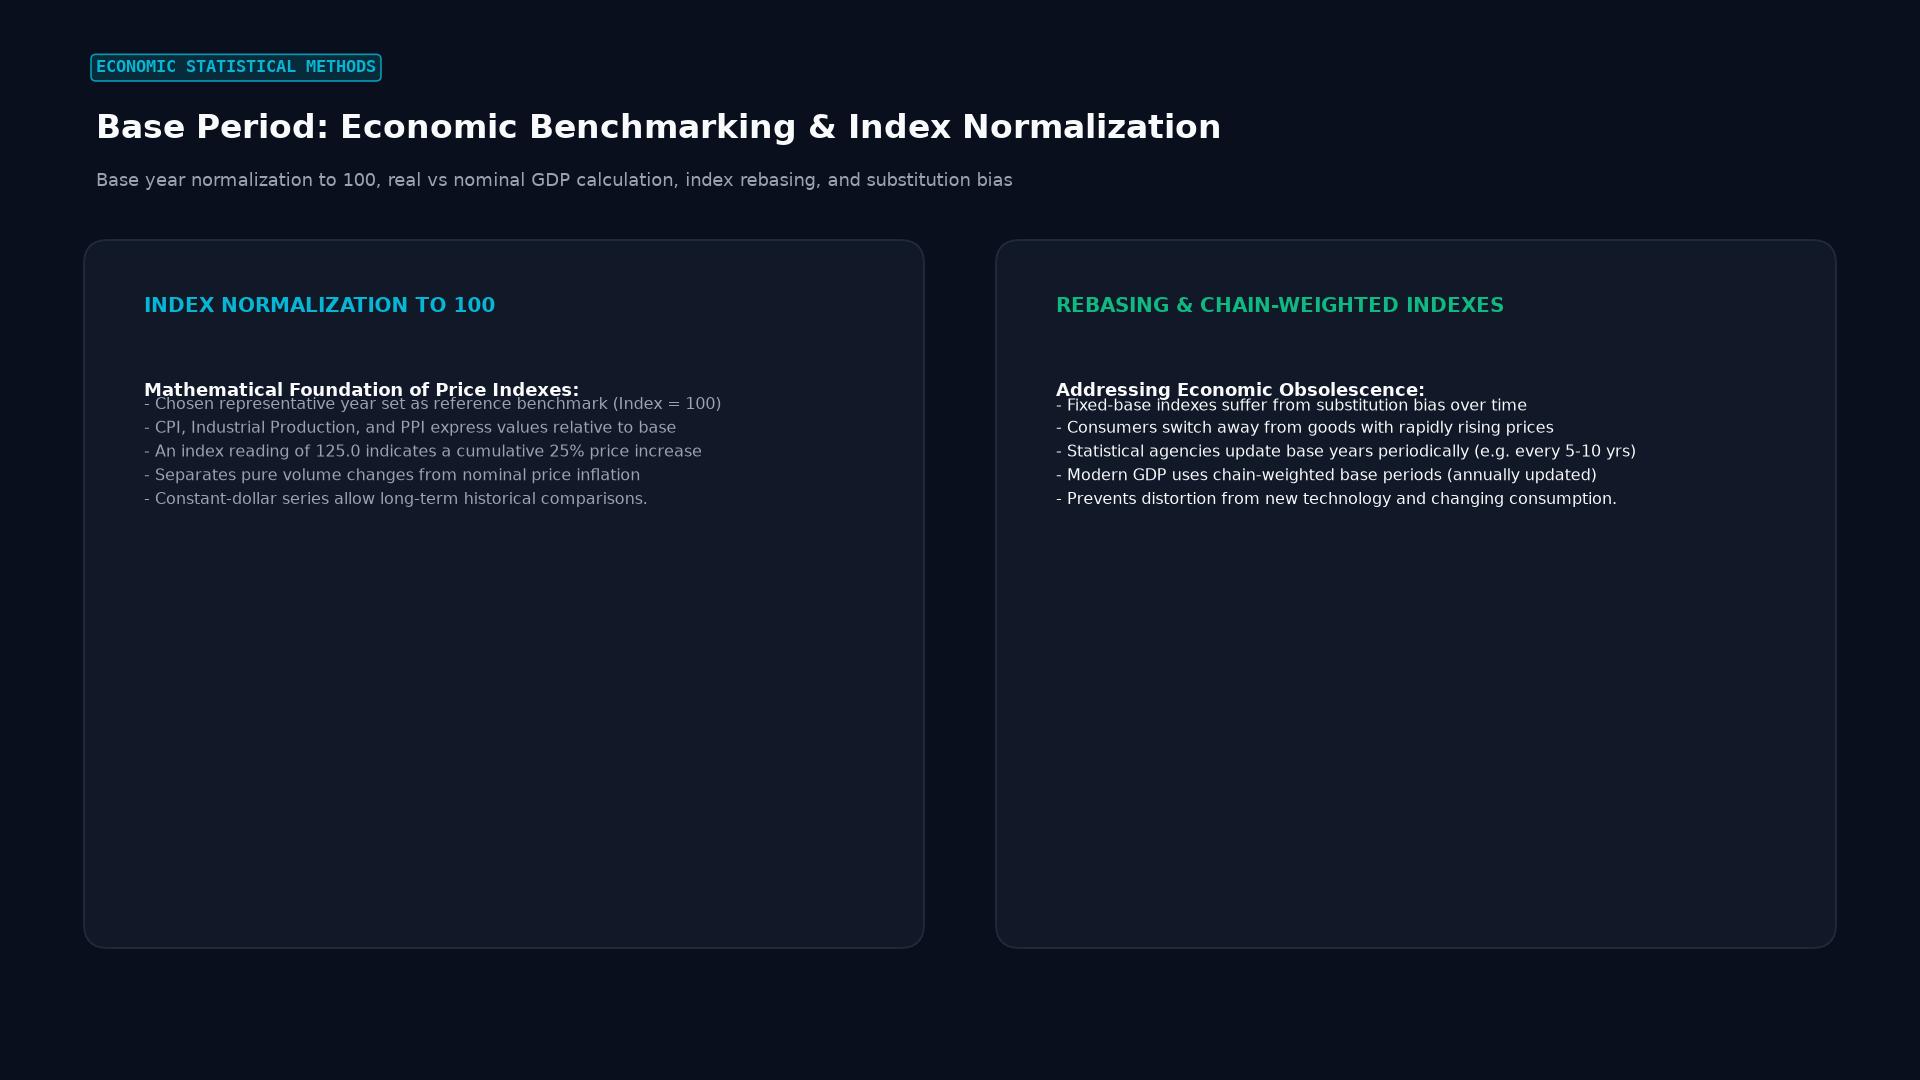 Figure: Base year normalization to 100, real vs nominal GDP calculation, index rebasing, and substitution bias
Statistical Formulation: Normalizing Economic Data
To convert raw chronological observations into an index, statisticians divide each period metric by the baseline value and scale by the chosen base coefficient:
$$\text{Index Value}_t = \left( \frac{\text{Observation}t}{\text{Observation}{\text{base}}} \right) \times 100$$
When tracking inflation, national statistical agencies measure the cost of an identical consumer basket across time. The United States Bureau of Labor Statistics (BLS) relies on the base period 1982–1984 = 100 for the headline Consumer Price Index for All Urban Consumers (CPI-U).
If the aggregate price of the consumer basket averaged $100 across 1982–1984 and reaches $315 in 2026, the index value reads 315.00. This indicates a 215% cumulative increase in the price of the reference consumer basket since the base period.
Index Methodology: Laspeyres, Paasche, and Fisher
The choice of base period intersects directly with the mathematical architecture used to compute price and quantity metrics:
+------------------------------------+------------------------------------+
| Laspeyres Index (Base Weighted)    | Paasche Index (Current Weighted)   |
+------------------------------------+------------------------------------+
| Uses quantities from the base      | Uses quantities from the current   |
| period as fixed weights.           | observation period as weights.     |
|                                    |                                    |
| Formula:                           | Formula:                           |
| L = [Sum(Pt * Q0) / Sum(P0 * Q0)]  | P = [Sum(Pt * Qt) / Sum(P0 * Qt)]  |
|                                    |                                    |
| Advantage: Requires quantity data  | Advantage: Reflects changing       |
| collection only once at base.      | consumer habits and new goods.     |
|                                    |                                    |
| Limitation: Upward substitution    | Limitation: Requires expensive new |
| bias (ignores cheaper goods).      | consumption surveys every period.  |
+------------------------------------+------------------------------------+
Because fixed base weights overstate inflation as consumers substitute expensive goods for cheaper alternatives, modern statistical bodies utilize chained indices. The Fisher Ideal Index takes the geometric mean of the Laspeyres and Paasche formulas, smoothing out the distortions introduced by an aging base period:
$$\text{Fisher Index} = \sqrt{\text{Laspeyres Index} \times \text{Paasche Index}}$$
The United States Bureau of Economic Analysis (BEA) applies chained-dollar methods to Real Gross Domestic Product (Real GDP), continuously rolling base weights across adjoining years rather than relying on a static multi-decade base period.
The Base Effect Phenomenon
The base effect describes how an unusual anomaly in the historical base period distorts headline annual growth comparisons, even when current monthly momentum remains completely normal.
       ILLUSTRATION OF THE BASE EFFECT ON YEAR-OVER-YEAR CPI

  Price Index Level
         │
  105.0  │                                    Current Run-Rate (+0.2%/mo)
  104.0  │                                    ┌─────┐     ┌─────┐
  103.0  │                                    │ May │     │ Jun │
  102.0  │                              ┌─────┘     └─────┘
  101.0  │                        ┌─────┘
  100.0  │                  ┌─────┘
   99.0  │            ┌─────┘
   98.0  │      ┌─────┘
   97.0  │      │ Previous Year Deflation / Shock (Base Period)
   96.0  │  ────┘
         └──────────────────────────────────────────────────────────── Time
                 Month t-12                       Month t
                 (Depressed Base)                 (Headline YoY Spikes)
Consider an oil price shock during an economic lockdown that collapses crude oil to $20 per barrel in April of Year 1 (the base period). By April of Year 2, oil normalizes to $60 per barrel:
- The year-over-year headline inflation rate for energy will read a massive $+200%$, driven purely by the depressed historical base.
- Even if energy prices remain completely flat from March of Year 2 to April of Year 2, the annual rate remains elevated.
Conversely, when an economy compares current figures against an abnormally elevated base period (such as an unprecedented inflation surge 12 months prior), the resulting year-over-year figures show sharp decelerations. Central bankers strip out base effects by monitoring 3-month annualized rates and month-over-month seasonally adjusted changes.
Fiscal, Tax, and Contractual Applications
Base periods govern legal covenants, tax brackets, and retirement benefits across modern economies:
- Tax Code Bracket Inflation: Under Internal Revenue Code (IRC) Section 1(f), the IRS adjusts income tax bracket thresholds annually to prevent bracket creep. The adjustments compare average cost-of-living metrics over a 12-month base period ending August 31 against a statutory reference period, shifting tax tiers upward.
- Social Security COLA Adjustments: The Social Security Administration evaluates third-quarter data (July, August, September) of the Consumer Price Index for Urban Wage Earners and Clerical Workers (CPI-W). If the current third-quarter average exceeds the third-quarter average of the prior base period year, benefits escalate by that percentage.
- Commercial Real Estate Leases: Commercial office leases frequently incorporate base year operating expense clauses. The tenant pays a pro-rata share of building maintenance, property taxes, and utility costs only to the extent they exceed the total expenses incurred during the lease first calendar year (the expense base period).
Corporate Finance: Baseline Budgeting and Variance Analysis
Within corporate treasury, the base period serves as the baseline for operational budgets and financial forecasting:
  Expense Category    Base Year Actual ($)    Current Year Actual ($)    Variance (%)
  -----------------------------------------------------------------------------------
  Direct Materials        $4,200,000                $4,830,000              +15.0%
  Direct Labor            $2,800,000                $2,940,000               +5.0%
  Factory Overhead        $1,500,000                $1,650,000              +10.0%
  Selling & Admin         $1,100,000                $1,155,000               +5.0%
  -----------------------------------------------------------------------------------
  Total Expenses:         $9,600,000               $10,575,000              +10.16%
Controllers compare current actuals against the established baseline to detect supply chain inefficiencies, raw material inflation, or unexpected overhead escalation. Periodic rebasing of the baseline budget ensures that obsolete operational assumptions do not distort strategic management decisions.
Frequently Asked Questions
Why do statistical agencies update or rebase their base periods?
Over extended horizons, consumer preferences, technology, and economic structures transform. Goods common in 1980 (typewriters, CRT televisions) disappear, while new categories (cloud subscriptions, electric vehicles, mobile devices) emerge. If agencies never updated base periods, the fixed weights would measure an obsolete economy, rendering economic metrics inaccurate.
How does rebasing an index affect historical percentage changes?
Rebasing an index changes the absolute index numbers across history by multiplying every observation by a constant mathematical conversion factor, but it leaves historical percentage changes between any two points completely unchanged. A 5% increase between 1995 and 1996 remains exactly 5% regardless of whether the base period is set to 1982 or 2015.
What is the difference between a calendar base period and a rolling base period?
A calendar base period remains fixed at a specific static calendar interval (such as the entire calendar year 2015 = 100) until the statistical bureau conducts a formal comprehensive benchmark revision. A rolling base period shifts continuously with time, such as measuring each month against the immediately preceding 12-month moving average, eliminating long-term drift.
Ready to trade forex?
Open a free demo account with a regulated broker. Practice with virtual funds before risking real money.