Cost Driver
A structural factor or measurable operational unit that causes a direct change in the total cost of an activity, serving as the foundational allocation mechanism in Activity-Based Costing.
What is a Cost Driver?
A cost driver is an operational variable, causal factor, or measurable unit of activity that directly causes a change in the total monetary cost of an organization’s business processes. In managerial accounting, corporate financial planning, and operational cost control, identifying cost drivers is the central requirement for tracing indirect expenses and factory overhead back to specific products, service contracts, customer accounts, and business segments.
Developed into modern management theory through the pioneer work on Activity-Based Costing (ABC) by Robin Cooper and Robert Kaplan in the late 1980s, the concept of a cost driver replaced traditional, arbitrary overhead allocation methods. Under traditional accounting, companies spread indirect costs across products using simplistic broad-brush volume metrics (such as direct labor hours or total machine run time). In contrast, cost-driver analysis establishes a direct cause-and-effect relationship between the consumption of organizational resources and the generation of final output.
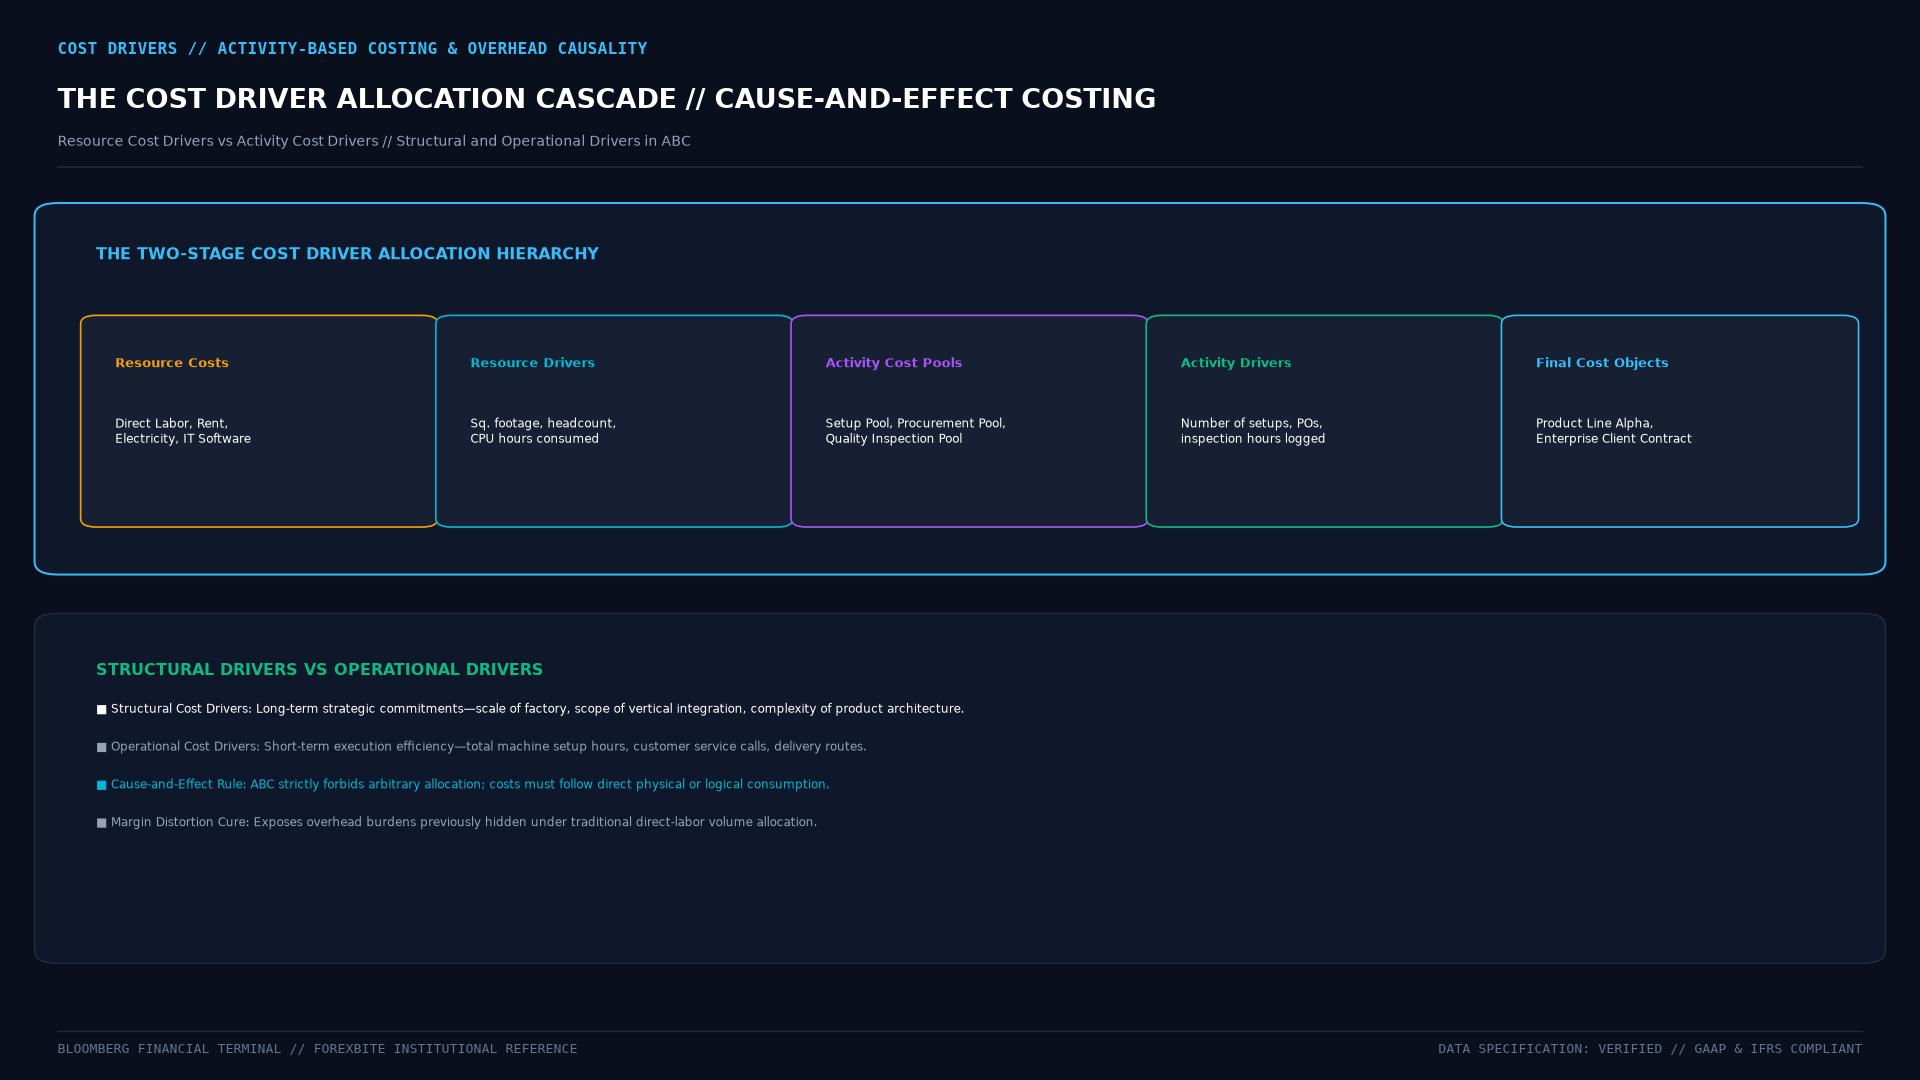 Figure: Cost driver hierarchy distinguishing between Resource Cost Drivers (allocating resource costs to activities) and Activity Cost Drivers (allocating activity costs to cost objects) to eliminate cost distortions.
The Three Tiers of Activity Cost Drivers
In operational cost accounting, managers categorize activity cost drivers into three primary classes based on measurement accuracy and data-collection costs:
+------------------------------------+------------------------------------+
| Cost Driver Category               | Operational Mechanism & Use Case   |
+------------------------------------+------------------------------------+
| 1. Transaction Drivers:            | Counts the absolute frequency of an|
| Lowest data-collection expense.    | activity (e.g., number of purchase |
| Assumes all events take identical  | orders, invoices billed, machine   |
| operational effort.                | setups executed, or lab tests run).|
|                                    |                                    |
| 2. Duration Drivers:               | Measures the elapsed time required |
| Moderate data-collection expense.  | to complete an activity (e.g.,     |
| Accounts for variance in duration  | machine setup hours, direct labor  |
| across different tasks.            | assembly hours, code audit hours). |
|                                    |                                    |
| 3. Intensity / Direct Charging:    | Directly traces specialized labor, |
| Highest accuracy and expense.      | custom tooling, and unique billable|
| Applied to complex, bespoke tasks. | resources directly to a designated |
|                                    | specialized contract or prototype. |
+------------------------------------+------------------------------------+
Mathematical Derivation of Cost Driver Rates
To allocate indirect overhead costs to final products, cost accountants calculate the Activity Cost Driver Rate:
$$\text{Cost Driver Rate} = \frac{\text{Total Budgeted Cost in Activity Pool}}{\text{Practical Capacity / Total Quantity of Cost Driver}}$$
Once the rate is established, the overhead cost assigned to a specific product or contract is derived by multiplying the actual quantity of driver units consumed:
$$\text{Allocated Activity Cost} = \text{Actual Units of Driver Consumed} \times \text{Cost Driver Rate}$$
Practical Industrial Example
Consider a specialized electronics manufacturer maintaining a Quality Control & Inspection department with an annual operating budget of $1,200,000.
- The identified cost driver is Number of Component Testing Hours.
- Engineering estimates a practical testing capacity of 6,000 hours per year.
- Cost Driver Rate: $\frac{$1,200,000}{6,000 \text{ hours}} = $200.00 \text{ per testing hour}$.
If producing a batch of 5,000 standard consumer resistors requires only 10 inspection hours, the batch absorbs: $$\text{Cost Burden} = 10 \times $200 = $2,000 \quad ($0.40 \text{ per resistor})$$
If producing a specialized batch of 100 aerospace circuit boards requires 80 inspection hours due to rigorous military stress testing, the batch absorbs: $$\text{Cost Burden} = 80 \times $200 = $16,000 \quad ($160.00 \text{ per circuit board})$$
Under traditional costing that spread inspection costs evenly based on units produced, the aerospace product would have been severely under-costed, while the standard consumer resistors would have been heavily over-costed.
Strategic Cost Drivers: Structural vs. Executional
In strategic management and competitive cost positioning, pioneered by Michael Porter, cost drivers extend beyond shop-floor accounting into long-term strategic decisions:
  Structural Cost Drivers              Executional Cost Drivers
  (Choices regarding economic scale)   (Operational execution & efficiency)
  ──────────────────────────────────────────────────────────────────────────
  * Plant Scale: Economies of scale    * Workforce Empowerment: Worker self-
    and minimum efficient scale.         inspection reducing scrap rates.

  * Scope: Vertical integration vs.    * Total Quality Management (TQM):
    outsourcing component supply.        Zero-defect continuous improvement.

  * Technology Selection: Capital      * Plant Layout Efficiency: Optimizing
    intensity vs. automated robotics.    physical workflow to cut transit time.

  * Product Complexity: Breadth of     * Supplier Quality Management: Direct
    product catalog variations.          dock-to-line parts delivery (JIT).
While structural drivers dictate an enterprise fundamental cost floor, executional drivers determine how close the organization operates to its theoretical productivity frontier.
Eliminating Cross-Subsidization
The strategic motivation for identifying accurate cost drivers is the elimination of cross-subsidization.
In traditional volume-based cost systems, indirect overhead is assigned based on direct labor or machine hours. This creates a dangerous distortion:
- High-Volume, Simple Products: Consume direct labor hours but require minimal administrative overhead, zero custom engineering, and rare production changeovers. They end up absorbing an unfair, disproportionate share of total factory overhead.
- Low-Volume, Complex Products: Require frequent machine setups, specialized quality inspections, complex purchase orders, and extensive engineering rework. Under volume costing, they receive a tiny overhead allocation because their direct run volume is small.
+------------------------------------+------------------------------------+
| Traditional Costing Trap           | Activity-Based Costing Reality     |
+------------------------------------+------------------------------------+
| Simple high-volume products appear | High-volume products are revealed  |
| artificially unprofitable due to   | to be highly lucrative cash cows;  |
| absorbing unearned overhead costs. | prices can be lowered to win share.|
|                                    |                                    |
| Complex low-volume customized goods| Complex niche products are revealed|
| appear highly profitable, leading  | to be massive loss-makers due to   |
| management to chase toxic revenue. | hidden setup and logistics costs.  |
+------------------------------------+------------------------------------+
By identifying the true cost drivers (such as setup hours and purchase orders rather than pure unit volume), corporate controllers can correctly reprice complex product lines or impose minimum order quantities, restoring operating profit margins.
Frequently Asked Questions
What is the difference between a resource driver and an activity cost driver?
A resource driver measures the quantity of organizational resources consumed by an activity (for example, the percentage of office square footage used to allocate rent to the procurement department). An activity cost driver measures the causal output of that activity used to allocate the accumulated pool costs down to the final cost object (for example, the number of purchase orders issued by procurement to buy raw materials for a specific product line).
Can a business process have more than one cost driver?
Yes. Complex business processes frequently involve multiple activities that require separate cost drivers. For instance, in an IT data center, data storage costs may be driven by gigabytes stored (volume), while customer helpdesk support costs are driven by the number of resolved trouble tickets (transaction) and resolution hours (duration).
How does an enterprise select the optimal cost driver?
Management evaluates three criteria: the strength of the statistical correlation between the driver and total incurred costs (the cause-and-effect relationship), the cost and feasibility of measuring and tracking the driver data, and the behavioral incentives created for employees (avoiding drivers that incentivize counterproductive workarounds).
Ready to trade forex?
Open a free demo account with a regulated broker. Practice with virtual funds before risking real money.