Factor Cost
A macroeconomic national accounting valuation metric that measures economic output based on the actual aggregate costs of productive inputs (wages, rents, interest, and operational profits), excluding indirect taxes and net of production subsidies.
Factor Cost
Factor cost (often referred to as factor valuation or input cost pricing) is a national income accounting metric that evaluates gross domestic product (GDP) or gross value added (GVA) by summing the actual payments made to the primary factors of production: wages to labor, rents to land, interest to financial capital, and operating profits to enterprise. By design, factor cost excludes product-level indirect taxes (such as sales taxes, value-added taxes, and excise duties) while adding back direct production subsidies provided by the government.
In macroeconomic analysis, sovereign credit rating assessments, and international trade accounting, factor cost answers a fundamental economic question: What did the productive machinery of the economy genuinely earn from manufacturing goods and rendering services, independent of government fiscal intervention? Understanding the mathematical wedge between output measured at factor cost, basic prices, and market prices allows macro traders and equity analysts to identify hidden tax burdens, evaluate corporate operating margin pressures, and interpret sovereign GDP revisions accurately.
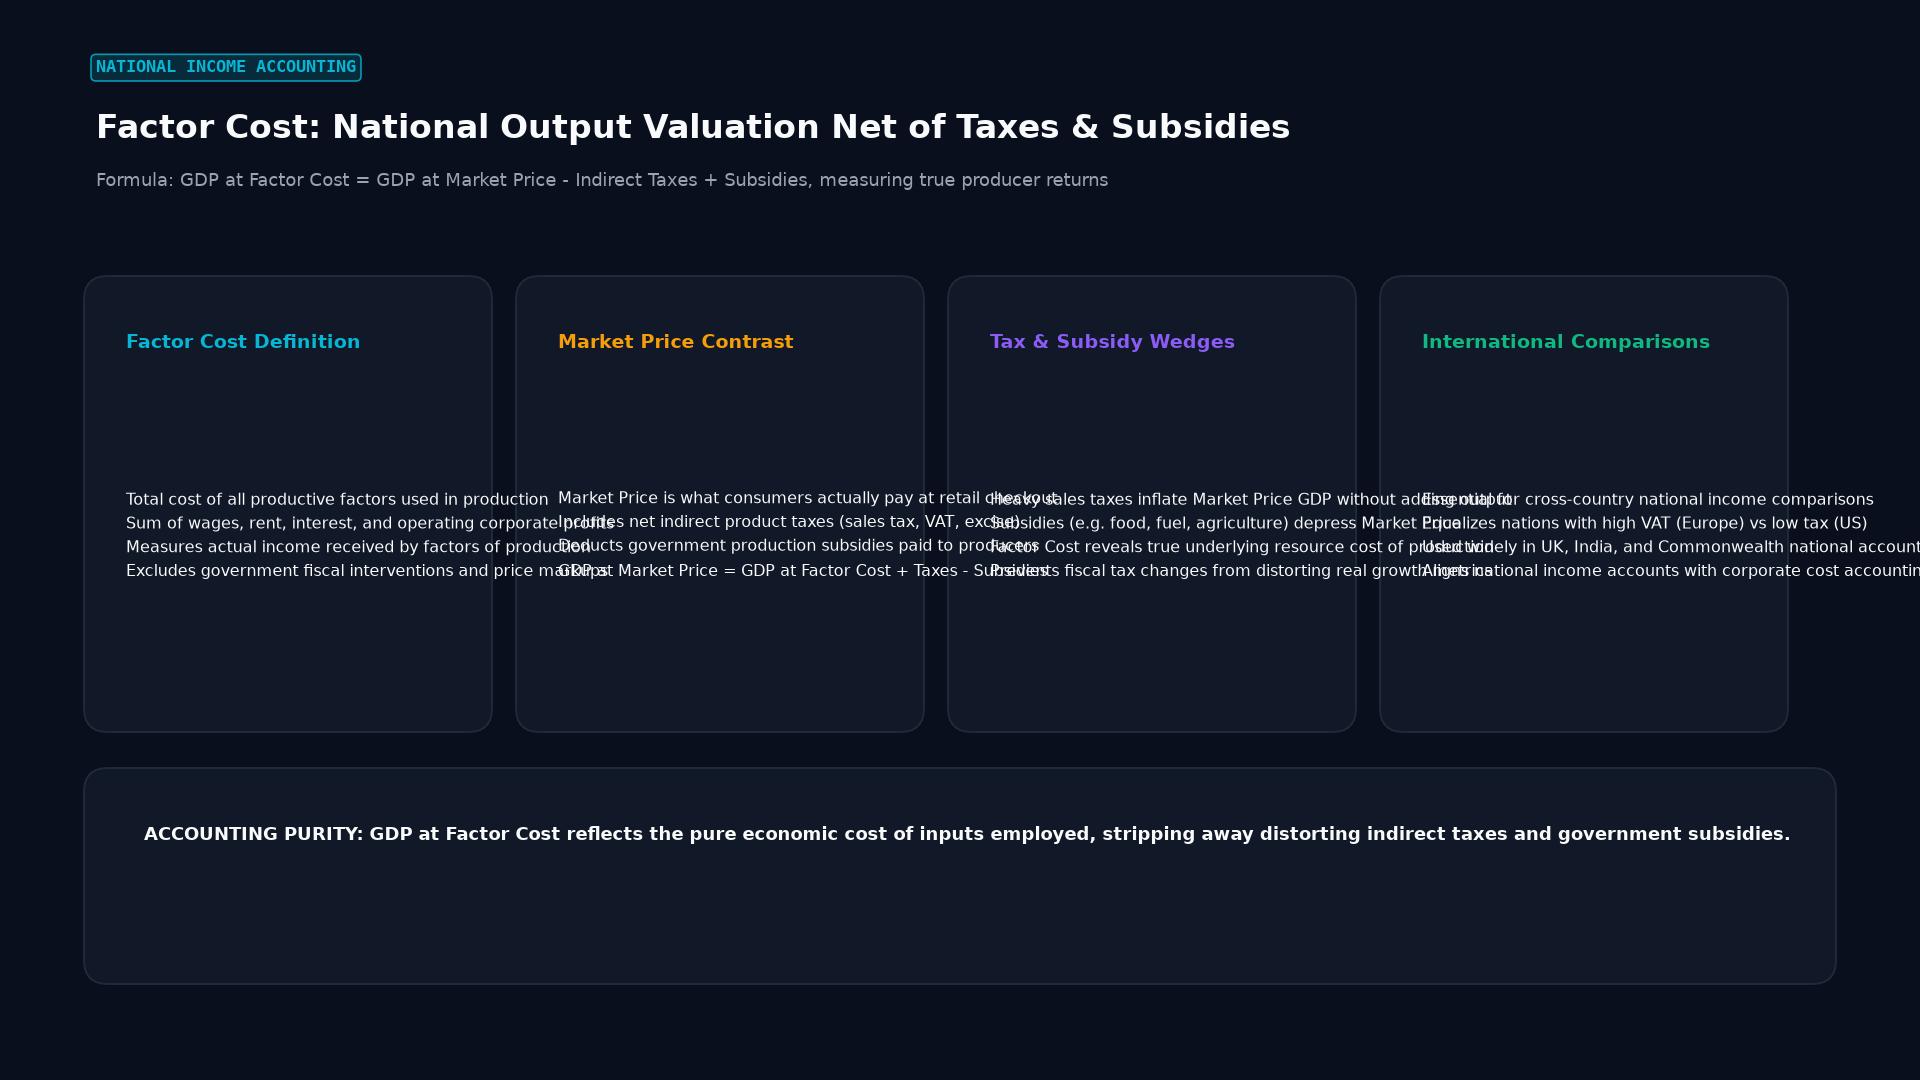 Figure: Formula: GDP at Factor Cost = GDP at Market Price - Indirect Taxes + Subsidies, measuring true producer returns
The Valuation Hierarchy in National Accounting
National statistical bureaus categorize economic output across three distinct valuation layers, each reflecting a specific stage of economic distribution:
+--------------------------------------------------------------------------+
|                  The Three Tiers of National Output Valuation            |
+--------------------------------------------------------------------------+
|  Valuation Basis      | Fiscal Adjustments Included | Analytical Utility |
+-----------------------+-----------------------------+--------------------+
|  1. Factor Cost       | Pure input costs; zero      | Analyzes corporate |
|     (GDP_FC)          | indirect taxes, zero        | earnings shares,   |
|                       | product subsidies           | wage trends, costs |
|  2. Basic Prices      | Includes production taxes   | Primary standard of|
|     (GVA_BP)          | and subsidies; excludes     | UN SNA 2008 for    |
|                       | product-level sales taxes   | industry analysis  |
|  3. Market Prices     | Includes all final indirect | Headline GDP metric|
|     (GDP_MP)          | taxes (VAT/GST); net of     | used in macro debt |
|                       | all consumer subsidies      | and trade ratios   |
+--------------------------------------------------------------------------+
Mathematical Formulations and Derivations
Under the United Nations System of National Accounts (UN SNA), the mathematical bridge connecting factor cost to headline market price GDP is established via Net Indirect Taxes (NIT):
$$GDP_{\text{Market Prices}} = GDP_{\text{Factor Cost}} + \text{Indirect Taxes} - \text{Subsidies}$$
$$GDP_{\text{Market Prices}} = GDP_{\text{Factor Cost}} + \text{NIT}$$
Where:
- $\text{Indirect Taxes}$ encompass wholesale excise duties, customs import tariffs, turnover levies, and consumption sales taxes (VAT or GST).
- $\text{Subsidies}$ encompass governmental cash transfers paid to commercial producers to reduce market retail prices (such as agricultural fertilizer supports, electrical tariff reductions, and public transit subsidies).
- $\text{NIT}$ represents Net Indirect Taxes. When $\text{NIT} > 0$ (the standard reality in modern economies), market price GDP mechanically exceeds factor cost GDP.
The Modern UN SNA 2008 Granular Partition
To eliminate ambiguity regarding which taxes apply to business operations versus specific product units, the modernized SNA 2008 standard bifurcates fiscal adjustments into production-level and product-level categories:
+--------------------------------------------------------------------------+
|                  Production vs. Product Fiscal Wedges                    |
+--------------------------------------------------------------------------+
|                                                                          |
|  1. Transition from Factor Cost to Basic Prices:                         |
|     GVA_Basic = GDP_Factor Cost + (T_production - S_production)          |
|                                                                          |
|     Where:                                                               |
|     - T_production: Taxes on production (commercial property taxes,      |
|       business license permits, pollution levies, stamp duties).         |
|     - S_production: Subsidies on production (payroll subsidies,          |
|       regional development grants, R&D tax incentives).                  |
|                                                                          |
|  2. Transition from Basic Prices to Market Prices:                       |
|     GDP_Market = GVA_Basic + (T_product - S_product)                     |
|                                                                          |
|     Where:                                                               |
|     - T_product: Taxes on products (sales tax, VAT/GST, excise, tariffs).|
|     - S_product: Subsidies on products (subsidized food staples, LPG).   |
|                                                                          |
+--------------------------------------------------------------------------+
Practical Numerical Illustration: Deconstructing an Industrial Asset
To see how factor cost differs from market price in practical commerce, consider the domestic production of a commercial transport vehicle:
+--------------------------------------------------------------------------+
|                  Cost Breakdown of Commercial Vehicle Unit                 |
+--------------------------------------------------------------------------+
|  Input Cost Component                    | Incurred Value                |
+------------------------------------------+-------------------------------+
|  Assembly Line Labor Wages (W)           | $12,000                       |
|  Factory Land & Facility Rental (R)      | $2,500                        |
|  Bank Financing & Equipment Interest (i) | $1,500                        |
|  Operating Profit Margin to Auto Firm (Π)| $4,000                        |
+------------------------------------------+-------------------------------+
|  A. TOTAL VALUE ADDED AT FACTOR COST     | $20,000                       |
+------------------------------------------+-------------------------------+
|  B. Plus: Municipal Industrial Land Tax  | +$800                         |
|  C. Less: Clean Energy Production Grant  | -$300                         |
+------------------------------------------+-------------------------------+
|  D. GROSS VALUE ADDED AT BASIC PRICES    | $20,500                       |
+------------------------------------------+-------------------------------+
|  E. Plus: National Goods & Services Tax  | +$3,690 (18% on $20,500)      |
|  F. Less: Government Electric Bus Rebate | -$1,500                       |
+------------------------------------------+-------------------------------+
|  G. FINAL VALUE ADDED AT MARKET PRICES   | $22,690                       |
+------------------------------------------+-------------------------------+
The final invoice paid by the municipal buyer is $22,690. However, the actual purchasing power distributed across the factors of production (the auto workers, the commercial bank, the landlord, and corporate equity holders) is exactly $20,000.
If a government sharply hikes the consumption tax rate from 18% to 28%, headline GDP at market prices will mechanically surge, creating the illusion of economic expansion. In reality, output at factor cost remains flat at $20,000, signaling zero organic productivity growth.
The Historic Case Study: India’s 2015 GDP Rebasing
The most prominent contemporary application of factor cost occurred in January 2015, when India’s Central Statistics Office (CSO) executed a comprehensive rebasing of the national accounts:
[ Pre-2015 Framework: India Headline Growth Reported as GDP at Factor Cost ]
                                    │
                                    ▼
[ January 2015 Revision: Base Year Shifted from 2004-05 to 2011-12 ]
  - Adopted UN SNA 2008 Guidelines
  - Replaced Factor Cost with GVA at Basic Prices & GDP at Market Prices
  - Integrated Corporate MCA21 Database (500,000+ Electronic Tax Filings)
                                    │
                                    ▼
[ STATISTICAL SHOCK: FY 2013-14 GDP Growth Revised from 4.7% to 6.9% ]
                                    │
                                    ▼
[ Global Skepticism: Reserve Bank of India & Institutional Forecasters ]
The Mechanism of the Growth Spike
Prior to 2015, India was one of the few major economies that reported its headline growth rate using GDP at factor cost. When the CSO rebased the series to market prices and basic prices:
- Tax Netting Effects: High indirect tax collections from rising corporate excise and fuel taxes boosted headline GDP at market prices relative to the older factor-cost series.
- Subsidies Compression: As the Indian government rationalized petroleum and fertilizer subsidies, the net tax wedge expanded, elevating reported growth.
Institutional investors, credit rating agencies (Moody’s, S&P), and the Reserve Bank of India initially questioned the credibility of the revised data, noting that underlying high-frequency indicators (rail freight traffic, commercial vehicle sales, bank credit growth) remained sluggish. The controversy demonstrated that macro analysts must audit whether growth stems from productive factors or statistical price base transitions.
Applications in Equity Research and Corporate Margin Analysis
Equity research desks and corporate credit underwriters evaluate factor cost data to forecast secular corporate margin trends:
+--------------------------------------------------------------------------+
|                  Factor Cost Indicators for Credit & Equities            |
+--------------------------------------------------------------------------+
|  Macroeconomic Signal    | Transmission to Financial Asset Valuations    |
+--------------------------+-----------------------------------------------+
|  Rising Wage Share       | When labor compensation absorbs an expanding   |
|  of Factor Cost          | proportion of factor cost, aggregate corporate|
|                          | operating margins compress, triggering equity |
|                          | earnings downgrades across cyclical sectors.  |
|  Expanding Net Indirect  | High product taxes widen the gap between what |
|  Tax Wedge               | consumers pay and what producers receive,     |
|                          | reducing consumer purchasing power and volume.|
|  Subsidy Deterioration   | Slashing production subsidies forces firms to |
|                          | raise factory-gate prices or absorb margin    |
|                          | contractions, elevating debt default risks.   |
+--------------------------------------------------------------------------+
By comparing industry-level GVA at basic prices against sector wage indices, analysts calculate unit labor costs and productivity trends. An industry where output at factor cost is expanding faster than labor payments indicates widening profit margins, identifying prime candidates for equity outperformance.
Frequently Asked Questions
Why have most statistical agencies abandoned GDP at factor cost?
International organizations (including the United Nations, IMF, OECD, and Eurostat) phased out factor cost in the 1993 and 2008 revisions of the System of National Accounts (SNA). They replaced it with Gross Value Added (GVA) at basic prices. Basic prices are easier to measure empirically at the establishment level because businesses record transaction prices including operating taxes rather than pure theoretical factor inputs.
Is factor cost the same as production cost in corporate accounting?
No. Corporate cost of production is a microeconomic accounting measure that includes raw materials, intermediate component inputs, depreciation, and localized business taxes paid to vendors. Factor cost is a macroeconomic national accounts concept that evaluates value added across the entire economy, summing only primary input rewards (wages, rent, interest, profit) while stripping out all intermediate goods.
Can GDP at market prices be lower than GDP at factor cost?
Yes, although it is rare in modern economies. If a government provides massive fiscal subsidies that exceed its total indirect tax revenues (making Net Indirect Taxes negative, $\text{NIT} < 0$), market price GDP will fall below factor cost GDP. This condition occasionally occurs in heavily subsidized agrarian economies or welfare states during wartime emergency food and fuel distribution.
Ready to trade forex?
Open a free demo account with a regulated broker. Practice with virtual funds before risking real money.