Mean Reversion
Mean reversion is a financial and statistical theory suggesting that asset prices, exchange rates, and volatility metrics eventually return to their historical average or baseline level after experiencing extreme deviations.
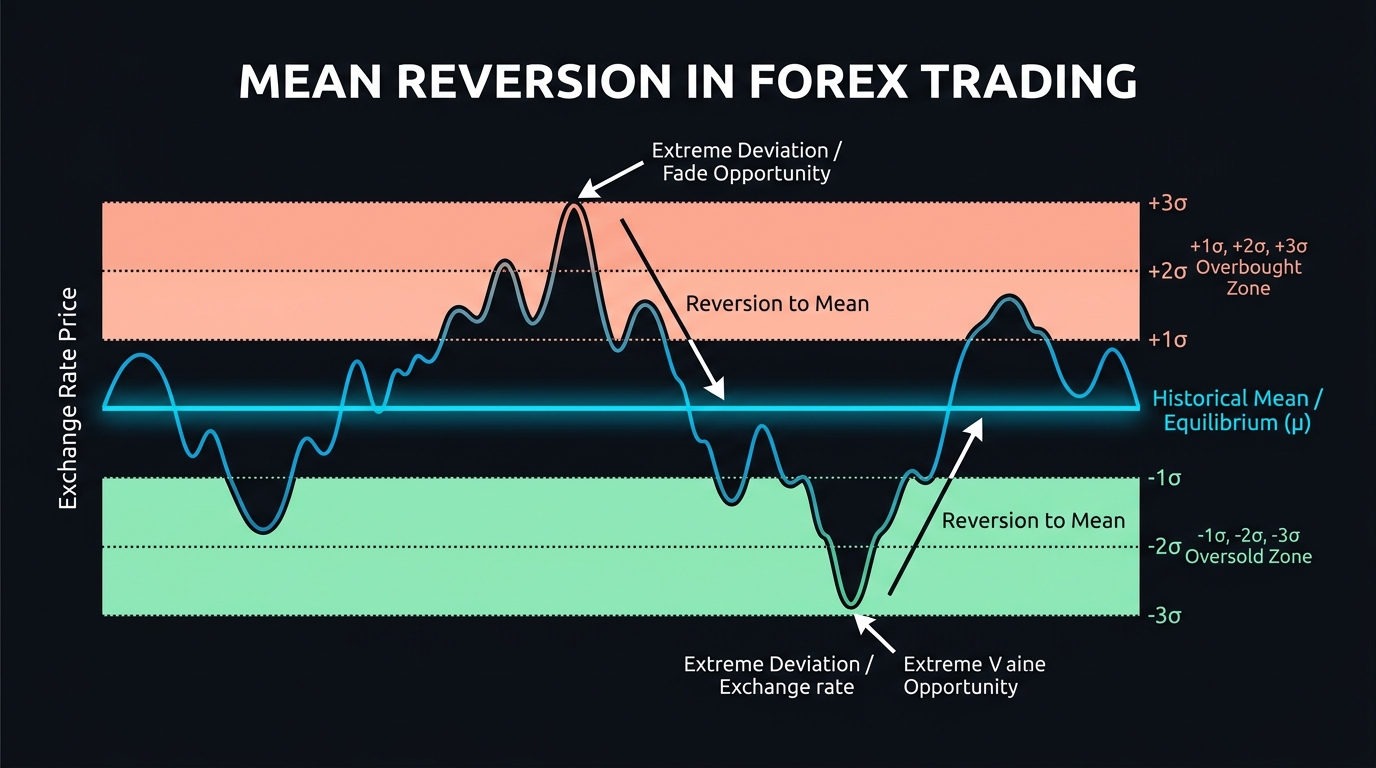
Mean reversion is a core financial theory rooted in statistics. It posits that asset prices, volatility levels, and valuation multiples oscillate around an equilibrium baseline over time. When an exchange rate diverges substantially from its historical mean—whether pushed by speculative frenzy, liquidity imbalances, or short-term macroeconomic announcements—the probability increases that the market will reverse direction toward that central anchor.
While trend followers seek out directional momentum and ride breakouts, mean-reversion traders capitalize on overextended market conditions, fading temporary spikes and buying into panic sell-offs.
The Mathematical Foundation of Mean Reversion
In quantitative finance, mean-reverting price dynamics are frequently modeled as an Ornstein-Uhlenbeck process, a continuous-time stochastic process described by the following differential equation:
$$dx_t = \theta (\mu - x_t)dt + \sigma dW_t$$
Where:
- $x_t$ represents the current exchange rate or asset price at time $t$.
- $\theta$ (theta) is the rate or speed of mean reversion.
- $\mu$ (mu) represents the long-term historical mean or equilibrium level.
- $\sigma$ (sigma) is the price volatility parameter.
- $dW_t$ is a standard Brownian motion (random market noise).
If an exchange rate sits far above its long-term average ($\mu$), the drift term becomes strongly negative, exerting a statistical pull back toward the center. In macroeconomic analysis, this long-term anchor often reflects economic fundamentals such as Purchasing Power Parity (PPP), terms of trade, or Real Effective Exchange Rates (REER).
Mean Reversion in Currency Markets
Foreign exchange markets display alternating market regimes: trending regimes and range-bound regimes. Approximately 70% to 80% of market time unfolds within horizontal trading ranges, making mean reversion a fundamental framework for retail and institutional currency desks.
Currency pairs driven by closely integrated economies often exhibit stronger mean-reverting properties than emerging market currencies. Classic examples include:
- EUR/GBP: Bound by geographic proximity and bilateral trade between the Eurozone and the United Kingdom.
- AUD/NZD: Strongly anchored by correlated commodity exports, geographic proximity, and synchronized central bank policies between Australia and New Zealand.
- Asian Session Consolidation: Before London and New York liquidity desks open, major pairs such as EUR/USD and USD/JPY frequently oscillate within tight 20- to 30-pip ranges around daily volume-weighted average prices (VWAP).
Core Technical Indicators Used in Mean-Reversion Trading
Traders quantify extreme deviations using statistical bands, oscillators, and moving averages:
| Tool | Mechanism | Mean-Reversion Trigger Signal |
|---|---|---|
| Bollinger Bands | 20-period SMA flanked by $\pm 2$ standard deviations | Price pierces the upper/lower band and forms a reversal candlestick back inside |
| Relative Strength Index (RSI) | Momentum oscillator scaled from 0 to 100 | RSI exceeds 70 (overbought) or falls below 30 (oversold) followed by a divergence |
| Z-Score | Measures the exact number of standard deviations from the mean | Z-score exceeds $+2.0$ or drops below $-2.0$ |
| Linear Regression Channels | Straight trendline with equidistant variance envelopes | Price touches extreme channel boundaries during non-trending periods |
Practical Example: Trading a Bollinger Band Reversion on EUR/GBP
Consider a swing trader monitoring EUR/GBP on a 4-hour chart. The 50-day simple moving average sits at 0.8540, serving as the intermediate equilibrium level.
- The Catalyst: An unexpected economic release in the UK causes rapid sterling depreciation. EUR/GBP spikes aggressively from 0.8540 up to 0.8625 within six hours.
- Identifying the Extreme: At 0.8625, the price trades more than 2.5 standard deviations above its 20-period moving average (piercing the upper Bollinger Band). Simultaneously, the 14-period RSI surges to 78, signaling deep overbought territory.
- Execution: The trader waits for the first 4-hour candle to close back inside the upper Bollinger Band at 0.8610, confirming exhaustion. They open a short position of 2.0 lots at 0.8610.
- Risk and Profit Targets:
- Stop-Loss: Placed above the swing high at 0.8640 (risking 30 pips, or $780 on the position).
- Take-Profit: Targeted at the 20-period moving average at 0.8550 (targeting 60 pips, or $1,560).
- Outcome: Over the following 36 hours, speculative enthusiasm cools, and corporate flow brings the exchange rate back toward the central average. The trade reaches 0.8550, delivering a 2:1 reward-to-risk ratio.
Mean Reversion vs. Trend Following
| Attribute | Mean-Reversion Strategy | Trend-Following Strategy |
|---|---|---|
| Market Regime | Sideways, consolidating, range-bound | Strong directional trends, breakout regimes |
| Win Rate | Typically high (60% to 75%) | Lower (35% to 45%) |
| Risk-Reward Ratio | Often modest (1:1 to 1.5:1) | High (2:1 to 5:1 or higher) |
| Primary Danger | Runaway trend causing catastrophic drawdown | Repeated whipsaws during range-bound chop |
| Trade Execution | Buying dips into support, selling rallies into resistance | Buying breakouts, adding to winning positions |
Key Takeaways
- Equilibrium Gravitation: Mean reversion relies on the principle that extreme price extensions are temporary and that exchange rates eventually revert toward historical baselines.
- Regime Dependency: The strategy flourishes during consolidation phases and cross-currency pairs (like AUD/NZD or EUR/GBP), but fails when macroeconomic catalysts spark sustained structural trends.
- Statistical Tools: Traders employ Bollinger Bands, RSI, Z-scores, and moving averages to measure price extensions beyond 2 standard deviations.
- The “Falling Knife” Danger: An asset can remain overbought or oversold far longer than an undercapitalized trader can remain solvent without strict stop-loss rules.
- Macro Drivers: On weekly and monthly charts, purchasing power parity and central bank interest rate differentials serve as fundamental gravity anchors for exchange rates.
Frequently Asked Questions
Why does mean reversion fail during strong market breakouts?
Mean reversion assumes a stationary or bounded price distribution. When a major catalyst occurs—such as an unexpected interest rate hike or a currency devaluation—the equilibrium mean itself shifts to a new level. Traders trying to fade the move are caught on the wrong side of an expanding structural trend.
What is the best timeframe for mean-reversion trading in forex?
Mean reversion operates across multiple horizons. Day traders apply it on 5-minute and 15-minute charts during the quiet Asian trading session using VWAP envelopes. Quantitative funds apply it on daily and weekly charts using cointegration models across correlated currency pairs.
What is pairs trading in the context of mean reversion?
Pairs trading is a market-neutral strategy where a trader simultaneously buys an undervalued currency and sells an overvalued currency within a historically cointegrated pair. The trade profits when the spread between the two assets reverts to its historical mean, regardless of the overall market direction.
Ready to trade forex?
Open a free demo account with a regulated broker. Practice with virtual funds before risking real money.