Bollinger Bands
Bollinger Bands are a volatility indicator consisting of three lines plotted on a price chart: a 20-period simple moving average in the center, and upper and lower bands set at two standard deviations above and below it. Created by John Bollinger in the 1980s, they expand during high volatility and contract during low volatility.
What Bollinger Bands Actually Measure
Most traders introduce Bollinger Bands as an overbought/oversold indicator — the idea being that price touching the upper band is “overbought” and touching the lower band is “oversold.” John Bollinger himself has spent years pushing back against this interpretation. It misses the point entirely.
Bollinger Bands measure volatility relative to recent history. When the bands are wide, the market is volatile. When they’re narrow, it isn’t. The relationship between price and the bands tells you where you are in the volatility cycle — which is a different and more useful question than “is this overbought?”
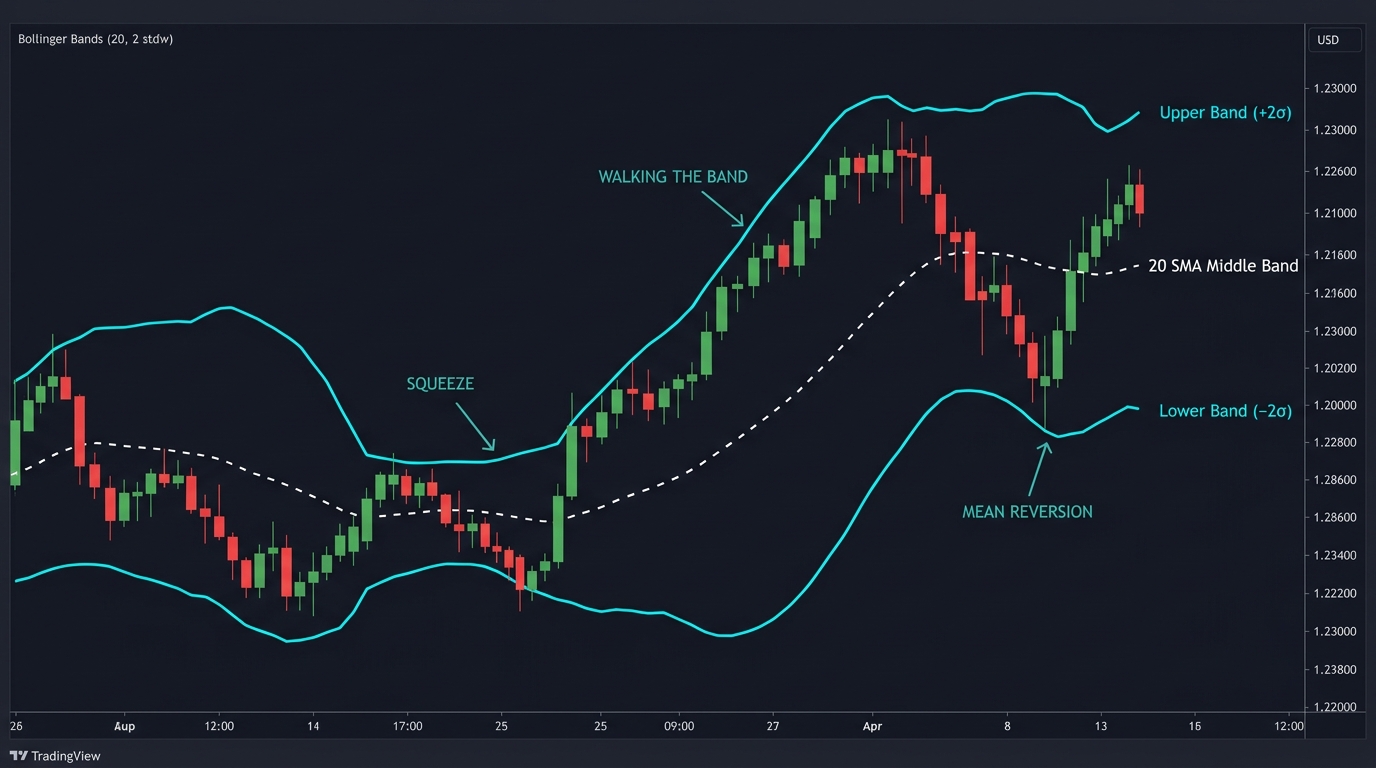
The Three Components
Middle Band: A 20-period Simple Moving Average (SMA). This is the baseline — the recent average price. John Bollinger’s original default settings are 20 periods and 2 standard deviations, and they remain the standard across most platforms.
Upper Band: Middle band + 2 standard deviations. Statistically, roughly 95% of price action should fall within 2 standard deviations of the mean. When price consistently closes above the upper band, that’s not a sell signal — it’s a sign of unusual strength.
Lower Band: Middle band − 2 standard deviations. Same logic in reverse.
Standard deviation is calculated fresh on each new period, so the bands automatically widen when price moves are larger than recent history and tighten when price consolidates. This self-adjusting quality is what makes them useful across different market conditions without manually changing settings.
The Squeeze: Where Big Moves Are Born
The Bollinger Band Squeeze is arguably the most actionable signal the indicator produces. It occurs when the bands narrow to their tightest point in months — the market has entered an exceptionally low-volatility period. Statistically, low volatility is a precursor to high volatility. The squeeze doesn’t tell you which direction the breakout will come; it tells you one is coming.
Traders watch for the bands to widen again and price to break decisively through one of the outer bands after a squeeze. That break, especially if accompanied by increasing volume, often marks the start of a sustained directional move.
A useful companion indicator: Bandwidth (Upper Band − Lower Band) / Middle Band. Plotting bandwidth as a separate panel shows you visually when the squeeze is at multi-month extremes — the setups with the most explosive follow-through.
Walking the Bands
In strong trending markets, price doesn’t reverse when it touches the upper band — it walks along it. EUR/USD in a strong uptrend can hug the upper Bollinger Band for 10–20 candles while the lower band provides the trailing support floor.
This is why simply selling when price touches the upper band is a losing strategy in trending conditions. It works beautifully in range-bound markets; it gets destroyed in trending ones. Identifying which market regime you’re in before applying Bollinger Band signals is essential.
A simple regime filter: if price is consistently closing above the middle band (20 SMA) for multiple periods, the trend is up — look for long entries at the middle band or lower band, not reversals at the upper band. When price oscillates around the middle band with no clear direction, the range-trading interpretation applies.
Practical Strategies Using Bollinger Bands
Mean Reversion (Range Markets): In a sideways market, buy when price closes below the lower band and bounces back through it. Sell when price closes above the upper band and reverses below it. Target: middle band. Stop: beyond the band extreme.
Breakout (After a Squeeze): Wait for a squeeze — 6 weeks of bandwidth at its lowest point in 6 months. When price breaks the upper or lower band with a strong, high-volume candle, enter in the direction of the break. This captures the volatility expansion that typically follows prolonged compression.
Double Bottom with W Pattern: Classic Bollinger reversal. First low touches or breaks the lower band. Rally to middle band. Second low holds above the lower band (higher low). Price then breaks above the middle band. This is a confirmed bullish reversal — the second test showing sellers can no longer push to the same lows.
Adjusting Settings for Different Timeframes
The 20/2 default is best on daily charts. On shorter timeframes:
- 1H chart: 20 periods / 2 standard deviations still works
- 15M chart: Some traders reduce to 15 periods for more responsiveness
- Monthly chart: 20 periods / 2 standard deviations remains standard
Changing the period affects sensitivity. Wider periods (50) create smoother, wider bands that catch only major moves. Narrower periods (10) create tighter, more reactive bands that generate more signals — and more false ones.
Key Takeaways
- Bollinger Bands measure volatility, not overbought/oversold conditions directly
- The squeeze (narrow bands) predicts an imminent volatility expansion — direction unspecified
- In trending markets, price “walks” the bands — avoid counter-trend signals
- The 20-period SMA middle band acts as dynamic support/resistance
- Mean reversion strategies work in ranges; breakout strategies work after squeezes
FAQ
Why do Bollinger Bands use 2 standard deviations? Two standard deviations contain approximately 95% of price data in a normally distributed dataset. This means price should only close outside the bands about 5% of the time — making those events worth paying attention to.
Can I use Bollinger Bands on any market? Yes. They’re applied to forex, stocks, commodities, and crypto equally. The self-adjusting volatility calculation makes them relevant regardless of the asset’s typical price range.
Ready to trade forex?
Open a free demo account with a regulated broker. Practice with virtual funds before risking real money.