Nikkei 225
The Nikkei 225 is the premier benchmark stock market index of Japan, tracking the price-weighted performance of 225 elite blue-chip companies traded on the Tokyo Stock Exchange.
What Is the Nikkei 225?
The Nikkei 225 (formally the Nikkei Stock Average, and known in Japan as the Nikkei Heikin Kabuki) is the preeminent barometer of the Japanese economy and the premier stock market index of Asian financial markets. Calculated and published continuously since September 1950 by Japan’s leading financial newspaper, the Nihon Keizai Shimbun (The Nikkei), the index tracks the performance of 225 top-tier, highly liquid blue-chip corporations listed on the Prime Market of the Tokyo Stock Exchange (TSE).
Representing world-renowned multinational corporations across technology, automotive manufacturing, robotics, and consumer electronics—such as Toyota Motor, Sony Group, Fast Retailing (Uniqlo), Tokyo Electron, and Nintendo—the Nikkei 225 serves as an indispensable reference asset for global investors. In foreign exchange (Forex) markets, the Nikkei maintains a celebrated structural correlation with the Japanese Yen (JPY): because Japan’s corporate titans are heavily export-dependent, fluctuations in the Yen directly drive Nikkei corporate profitability and international capital flows.
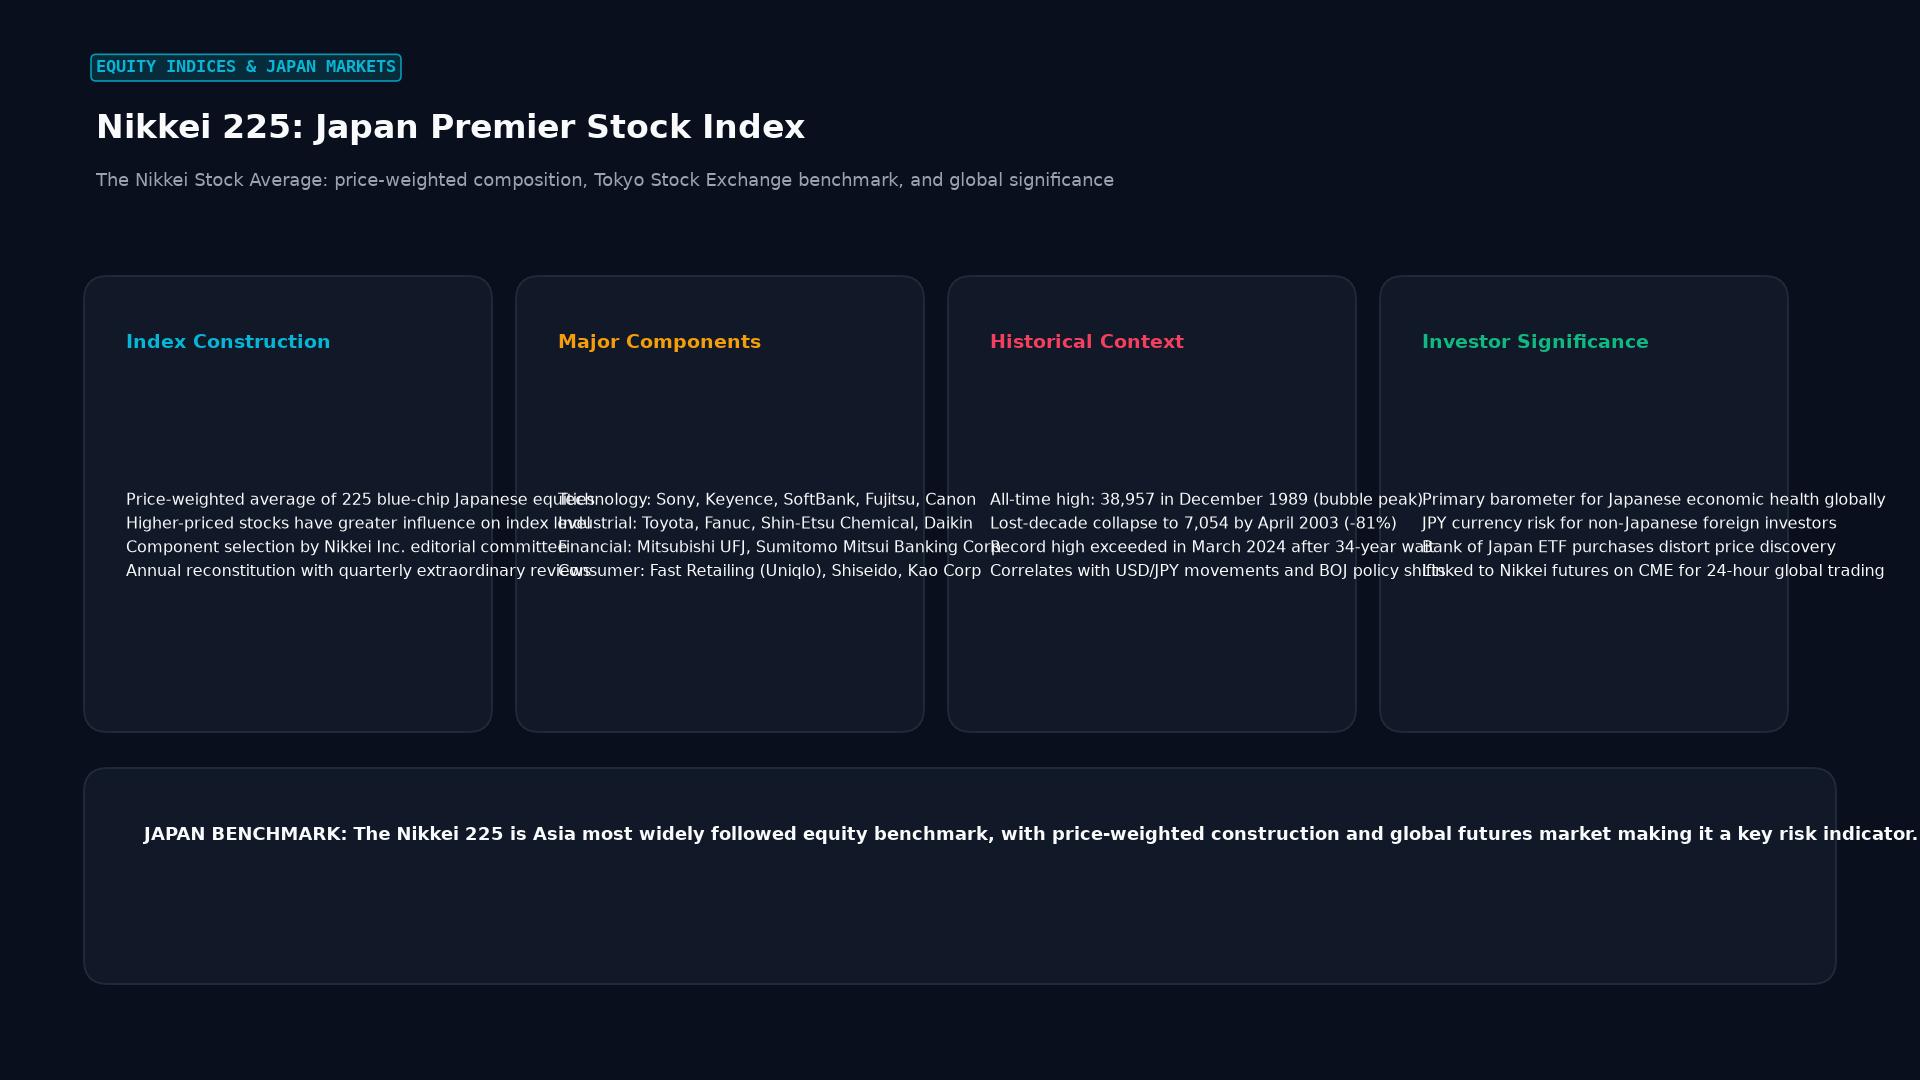 Figure: The Nikkei Stock Average: price-weighted composition, Tokyo Stock Exchange benchmark, and global significance
Key Takeaways
- Price-Weighted Construction: Like the U.S. Dow Jones Industrial Average (DJIA), the Nikkei 225 is price-weighted, meaning stocks with higher absolute share prices exert a significantly larger mathematical influence on the index than low-priced stocks, irrespective of company market capitalization.
- The Export / Currency Feedback Loop: Historically, the Nikkei exhibits a powerful inverse correlation with the Japanese Yen (and positive correlation with USD/JPY): a weakening Yen boosts exporters’ corporate earnings and drives Nikkei rallies.
- The 34-Year Record Journey: After peaking at 38,915 in December 1989 at the apex of Japan’s historic asset price bubble, the index endured the “Lost Decades,” bottoming near 7,000 in 2009 before finally smashing its all-time high in February 2024, surging past 40,000 points.
- Annual Index Review: The components of the Nikkei 225 are formally reviewed annually every October by the Nikkei newspaper committee to maintain sector balance across technology, consumer goods, materials, capital goods, and finance.
- Nikkei vs. TOPIX: While the Nikkei is the internationally famous retail headline index (price-weighted, 225 stocks), domestic Japanese institutional pension funds and asset managers benchmark performance against the TOPIX (free-float market-capitalization weighted).
Comparative Taxonomy: Nikkei 225 vs. Global Benchmark Indices
| Structural Dimension | Nikkei 225 (Japan) | TOPIX (Japan) | Dow Jones Industrial (US) | S&P 500 (US) |
|---|---|---|---|---|
| Weighting Method | Price-Weighted | Market-Cap Weighted | Price-Weighted | Market-Cap Weighted |
| Component Count | 225 elite companies | ~2,000+ (All Prime TSE) | 30 mega-cap companies | 500 large-cap companies |
| Publisher / Custodian | Nihon Keizai Shimbun | Japan Exchange Group | S&P Dow Jones Indices | S&P Dow Jones Indices |
| Sector Concentration | High tech & consumer weighting | Broad economic reflection | High industrial & financial | Diversified broad market |
| Distortion Risk | Single high-price stocks | Mega-cap tech dominance | Single high-price stocks | “Magnificent Seven” caps |
The Mathematics of the Nikkei 225 Index Calculation
The Nikkei 225 is computed as the sum of adjusted stock prices divided by a dynamic Divisor:
$$\text{Nikkei 225}t = \frac{\sum{i=1}^{225} \left( P_{i,t} \times \text{Price Adjustment Factor}_i \right)}{\text{Divisor}_t}$$
Where:
- $P_{i,t}$ is the current share price of constituent company $i$.
- $\text{Price Adjustment Factor}_i$ normalizes for par value differences (standardized to 50 Yen par).
- $\text{Divisor}_t$ is an adjusted coefficient maintained continuously to ensure that corporate actions (such as stock splits, reverse splits, or company replacements) do not artificially dislocate the index value.
The “Fast Retailing” Weighting Distortion:
Because the index is price-weighted, companies with extremely high share prices possess disproportionate weight. For instance, Fast Retailing (the parent company of Uniqlo) often accounts for 10% to 11% of the entire Nikkei 225, meaning a 3% swing in a single clothing retailer can move the entire Japanese national index more than movements in dozens of industrial and automotive giants combined.
Real-World Case Study: The Historic 2024 All-Time High Breakout
On February 22, 2024, the Nikkei 225 achieved one of the most celebrated milestones in modern financial market history:
- The 34-Year Stagnation: In December 1989, at the peak of the Japanese economic bubble, the Nikkei reached 38,915.87. Following the real estate and banking collapse, Japan entered decades of structural deflation, zero interest rates, and population aging.
- The Catalysts of the Renaissance (2023–2024):
- Corporate Governance Revolution: The Tokyo Stock Exchange (TSE) pressured listed companies trading below Book Value ($P/B < 1.0$) to improve return on equity (ROE), buy back shares, and boost dividends.
- Weak Yen Tailwinds: USD/JPY surged past 150.00, resulting in record-breaking export profits for Japanese multinationals.
- The “Buffett Effect”: Warren Buffett’s Berkshire Hathaway visibly expanded investments in Japan’s five major general trading houses (sogo shosha), attracting hundreds of billions in foreign institutional capital.
- The Breakout: On February 22, 2024, the Nikkei rallied past 39,098, definitively shattering its 1989 bubble record, and subsequently crossed the historic 40,000 milestone, signaling Japan’s triumphant exit from multi-decade deflation.
Trading Correlations for Forex Market Participants
- USD/JPY Long Correlation: For decades, day traders have watched the Nikkei 225 when trading USD/JPY during the Asian session. An aggressive morning rally in the Nikkei almost always coincides with buying pressure in USD/JPY.
- Risk-Off Safe-Haven Flows: During global market panics (such as geopolitical escalations or banking scares), international carry trades unwind. Global investors dump Japanese equities (crashing the Nikkei) and buy back the Japanese Yen for safe-haven protection, causing USD/JPY to plunge.
Frequently Asked Questions (FAQ)
What time does the Nikkei 225 trade?
The physical Tokyo Stock Exchange equity market operates in two continuous daily sessions: the Morning Session (09:00 to 11:30 JST / 00:00 to 02:30 GMT) and the Afternoon Session (12:30 to 15:30 JST / 03:30 to 06:30 GMT). Nikkei futures (traded on the Osaka Exchange and CME) trade virtually 24 hours a day.
Can retail traders trade the Nikkei 225 on MetaTrader?
Yes. Retail forex and CFD brokers offer derivative contracts on the Nikkei 225, typically listed under the ticker symbol JP225, JPN225, or NIKKEI, allowing retail traders to go long or short with leverage during both Asian and Western trading hours.
Why do some investors prefer TOPIX over the Nikkei 225?
Professional fund managers prefer the TOPIX because it is weighted by market capitalization and includes over 2,000 companies, providing a statistically comprehensive and accurate representation of the total Japanese economy without being distorted by high-priced individual stocks.
Ready to trade forex?
Open a free demo account with a regulated broker. Practice with virtual funds before risking real money.