Correlation
Correlation in financial markets measures the statistical degree to which two assets, currency pairs, or economic variables move in relation to one another, quantified by a correlation coefficient ranging from -1.0 to +1.0.
What Is Currency Correlation?
In financial markets and quantitative analysis, correlation is a statistical metric that measures the degree and direction of the linear relationship between the price movements of two distinct assets, securities, or foreign exchange pairs. Quantified through the Pearson correlation coefficient ($r$), the metric ranges strictly between -1.00 and +1.00.
Because all currency pairs share overlapping national economies, global trade links, commodity dependencies, or a common base/quote currency (such as the U.S. Dollar), no currency pair trades in complete isolation. Understanding currency correlations is essential for portfolio risk management: failing to account for correlation can inadvertently double a trader’s risk exposure or cause competing positions to cancel each other out entirely.
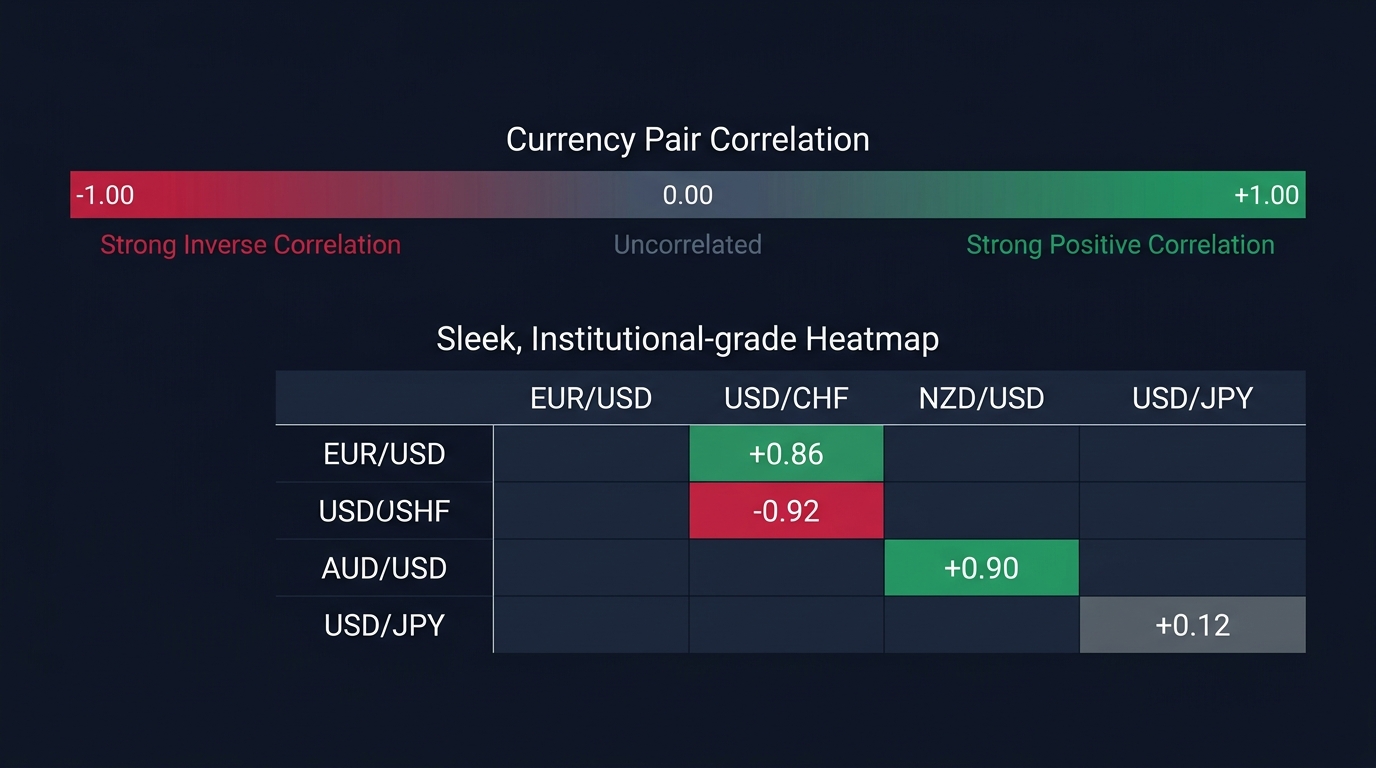
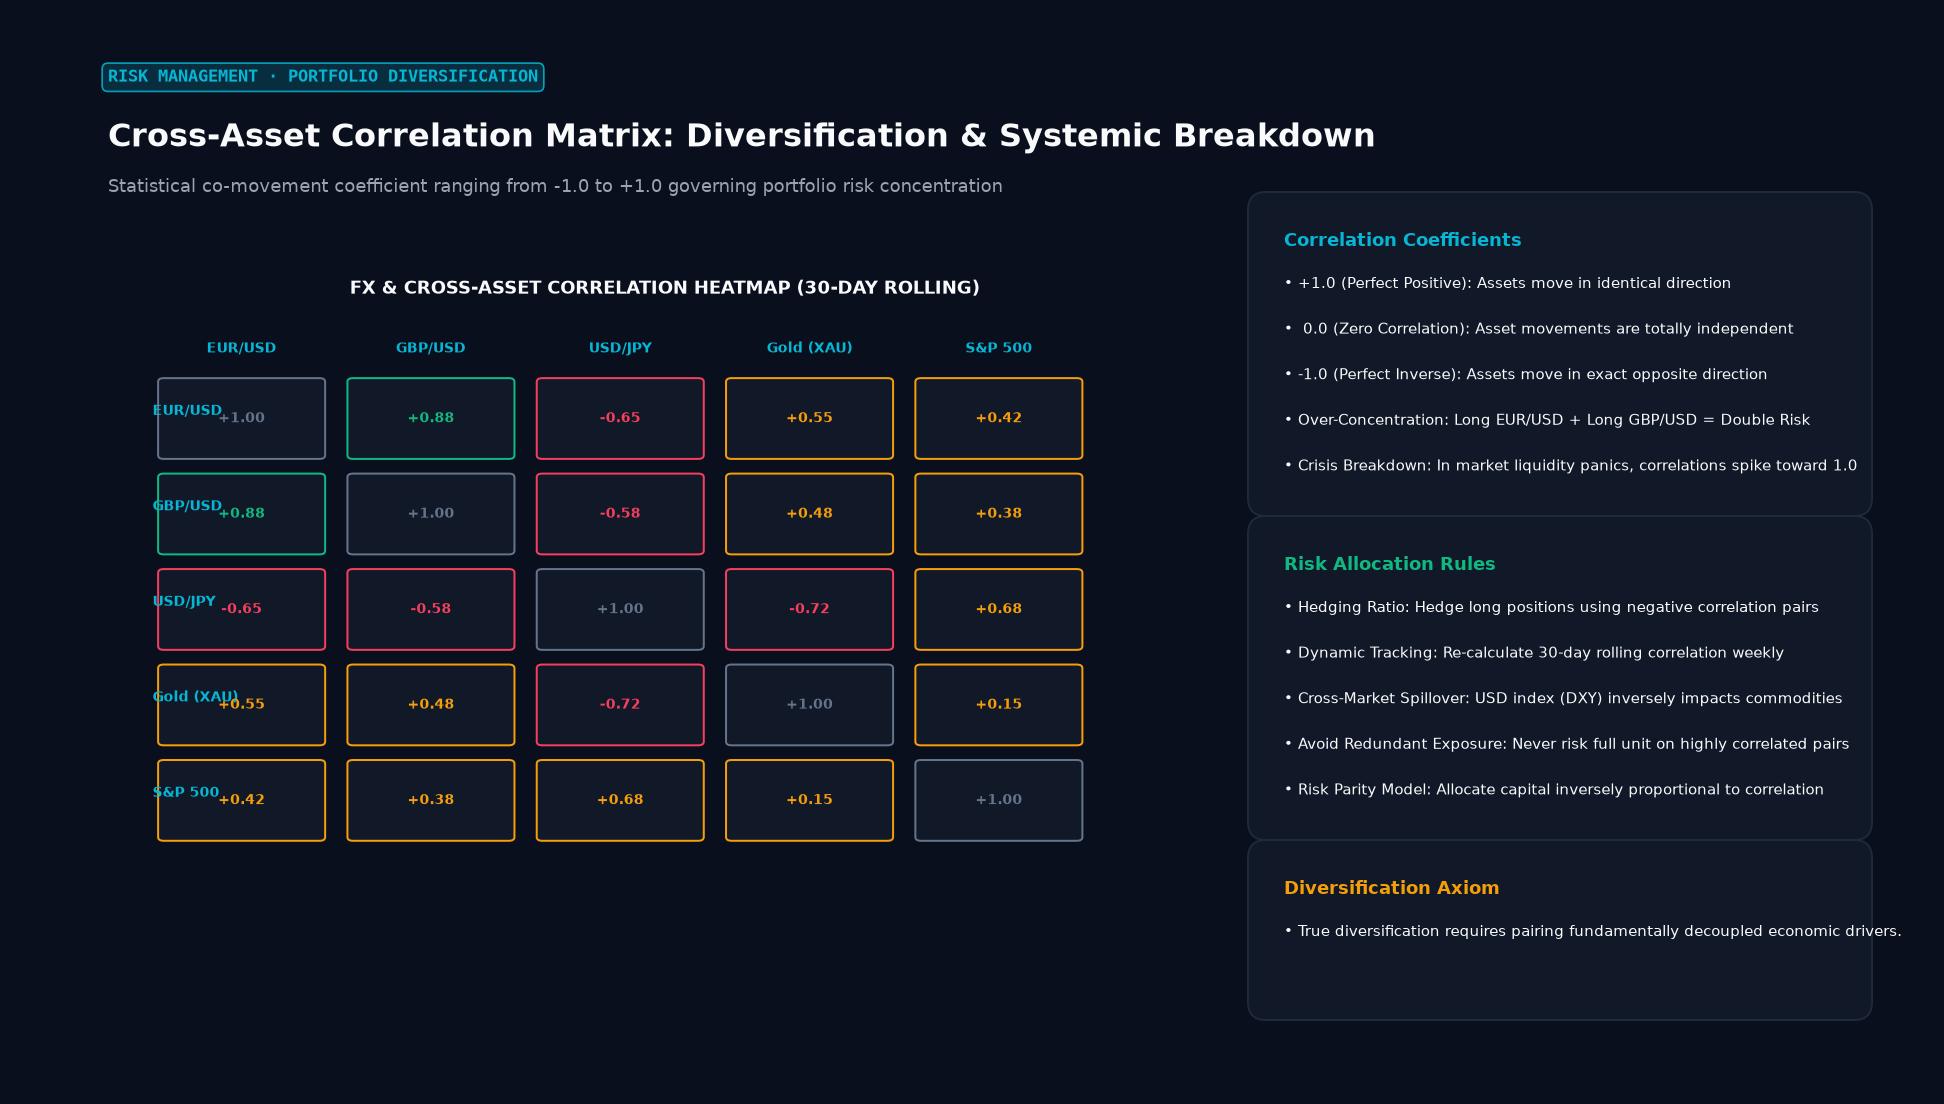 Figure: Statistical co-movement coefficient ranging from -1.0 to +1.0 governing portfolio risk concentration
Key Takeaways
- The Correlation Coefficient Scale: Values between +0.70 and +1.00 indicate strong positive correlation; values between -0.70 and -1.00 indicate strong inverse (negative) correlation; values near 0.00 indicate no linear relationship.
- Accidental Risk Doubling: Going long on both EUR/USD and GBP/USD does not diversify risk; because both pairs possess a strong positive correlation, the trader is effectively doubling their short-dollar directional exposure.
- Inter-Market Dependencies: Certain currencies maintain structural correlations with physical commodities: the Canadian Dollar (CAD) correlates positively with Crude Oil, while the Australian Dollar (AUD) correlates with Gold and industrial metals.
- Dynamic Nature: Correlations are not static physical laws; they shift dynamically across different market regimes, interest rate cycles, and crisis periods.
Mathematical Formulation: The Pearson Correlation Coefficient
The Pearson correlation coefficient ($r$) between two price return series $X$ and $Y$ over $N$ observation periods is calculated as:
$$r = \frac{\sum_{i=1}^{N} (X_i - \bar{X})(Y_i - \bar{Y})}{\sqrt{\sum_{i=1}^{N} (X_i - \bar{X})^2 \sum_{i=1}^{N} (Y_i - \bar{Y})^2}}$$
Where:
- $X_i, Y_i$ = Percentage price returns of assets $X$ and $Y$ on day $i$
- $\bar{X}, \bar{Y}$ = Mean percentage returns of assets $X$ and $Y$ over the period
- $N$ = Number of observation periods (e.g., 30, 90, or 365 trading days)
Benchmark Currency Pair Correlation Matrix
The table below illustrates typical historical correlation behaviors across major foreign exchange pairs:
| Currency Pair Combination | Typical Correlation ($r$) | Underlying Economic & Structural Driver |
|---|---|---|
| EUR/USD vs. GBP/USD | +0.80 to +0.90 (Strong Positive) | Both represent European economies heavily tied to trade and shared counter-currency (USD) |
| AUD/USD vs. NZD/USD | +0.85 to +0.95 (Strong Positive) | Geographic proximity, shared Asia-Pacific export orientation, commodity linkages |
| EUR/USD vs. USD/CHF | -0.85 to -0.95 (Strong Inverse) | The Swiss Franc mirrors the Euro zone economically, but USD is the base currency in USD/CHF |
| USD/CAD vs. WTI Crude Oil | -0.65 to -0.80 (Inverse USD/CAD) | Canada is a major net oil exporter; higher oil strengthens CAD, causing USD/CAD to decline |
| AUD/USD vs. Gold (XAU/USD) | +0.60 to +0.75 (Moderate Positive) | Australia is one of the world’s top gold producers and exporters |
| EUR/USD vs. USD/JPY | -0.20 to +0.30 (Low / Variable) | Influenced independently by distinct central bank rate divergence and global risk sentiment |
Strategic Portfolio Applications for Forex Traders
Professional currency managers utilize correlation analysis to execute distinct risk-mitigation and tactical strategies:
1. Eliminating Counter-Productive Hedging
If a trader opens a Long EUR/USD position and simultaneously opens a Long USD/CHF position, they have essentially created a self-canceling trade. Because EUR/USD and USD/CHF share an almost perfect negative correlation, gains on one pair will be systematically wiped out by losses on the other, while paying double the broker spreads and commissions.
2. Diversifying Aggregate Exposure
A trader seeking to express a bearish view on the U.S. Dollar can divide their position size across moderately correlated pairs (such as EUR/USD and AUD/USD) rather than placing a single oversized bet on one pair. This dampens idiosyncratic risks, such as unexpected local political events in Europe or bad domestic weather data in Australia.
Portfolio Risk Comparison:
- Strategy A: Buy 4.0 Standard Lots of EUR/USD ──► 100% idiosyncratic Eurozone exposure
- Strategy B: Buy 2.0 Lots EUR/USD + 2.0 Lots AUD/USD ──► Balanced global short-USD exposure
Correlation Breakdown During Market Crises
One of the most dangerous phenomena in quantitative risk modeling is correlation breakdown. During normal market cycles, assets may exhibit diverse, low correlations. However, during systemic financial crises (such as the 2008 Lehman collapse or the March 2020 liquidity shock), global correlation patterns collapse toward extremes:
$$\lim_{\text{panic} \to \infty} r_{\text{risk assets}} = +1.00$$
- All risk-sensitive currencies (AUD, NZD, CAD, GBP, emerging market currencies) plunge in unison against the safe-haven U.S. Dollar and Japanese Yen.
- Traders who believed their multi-pair portfolios were safely diversified experience severe aggregate drawdown because historical statistical independence vanishes during a panic.
Real-World Case Study: Trading the CAD / Oil Correlation Disconnect
Canada’s economy is structurally linked to energy exports, establishing a strong historical correlation where surging crude oil prices strengthen the Canadian Dollar (pushing USD/CAD lower).
The Divergence Setup:
- Over three weeks, WTI crude oil prices surge from $72.00 to $86.00 per barrel (+19.4%) due to geopolitical pipeline disruptions.
- Simultaneously, USD/CAD fails to decline and instead remains pinned at 1.3650 due to temporary domestic Canadian inflation weakness.
- Quantitative analysis reveals that the 30-day rolling correlation between USD/CAD and WTI oil has detached from its historical $-0.75$ baseline to $+0.10$.
The Trade Execution:
- Recognizing an unsustainable statistical divergence, macro traders short USD/CAD at 1.3650, anticipating mean reversion toward the oil-backed fundamental fair value.
- Within ten trading sessions, foreign exchange desks reprice the massive energy trade surplus entering Canada. USD/CAD drops sharply from 1.3650 to 1.3380 (a 270-pip gain), restoring the structural negative correlation.
Frequently Asked Questions
How often should forex traders calculate currency correlations?
Because central bank policies and macroeconomic trends shift over time, correlation coefficients change. Active traders should monitor rolling correlation tables across multiple lookback windows: 1-week (short-term noise), 1-month (swing trends), and 3-month to 1-year (structural macro relationships).
Can two currency pairs have a 0.00 correlation forever?
No. While certain pairs may demonstrate a near-zero correlation over a specific 30-day observation window, macro events (such as Federal Reserve rate decisions or global geopolitical shifts) will periodically pull their pricing into transient positive or negative alignment.
Where can retail traders find currency correlation tables?
Most modern charting platforms (such as TradingView) feature built-in correlation coefficients (CORR indicator). Additionally, many forex analytic portals publish daily updated correlation matrices covering all major, minor, and exotic currency pairs.
Ready to trade forex?
Open a free demo account with a regulated broker. Practice with virtual funds before risking real money.