Reaction
In technical analysis and market dynamics, a reaction (or reaction pullback) is a temporary, counter-trend price retracement that interrupts an established primary market trend following an extended directional advance or immediately after a high-impact macroeconomic catalyst.
What Is a Market Reaction?
In technical market analysis, Dow Theory, and price action trading, a reaction designates a temporary counter-trend movement that interrupts the path of an ongoing primary trend. When an asset experiences a sustained upward advance (a rally), prices eventually reach a temporary exhaustion point where buyers hesitate, short-term traders take profits, and counter-trend sellers step in, causing price to pull back—a dynamic classical technicians termed a downward reaction.
Conversely, during an established bear market, an oversold bounce or sharp upward retracement is referred to as an upward reaction.
Unlike a full structural trend reversal—which permanently alters the macroeconomic direction of an asset—a reaction is an expected, healthy component of sustainable trend mechanics. In market structure, the turning point where a reaction terminates and the primary trend resumes establishes critical reference points known as Reaction Lows (in uptrends) or Reaction Highs (in downtrends).
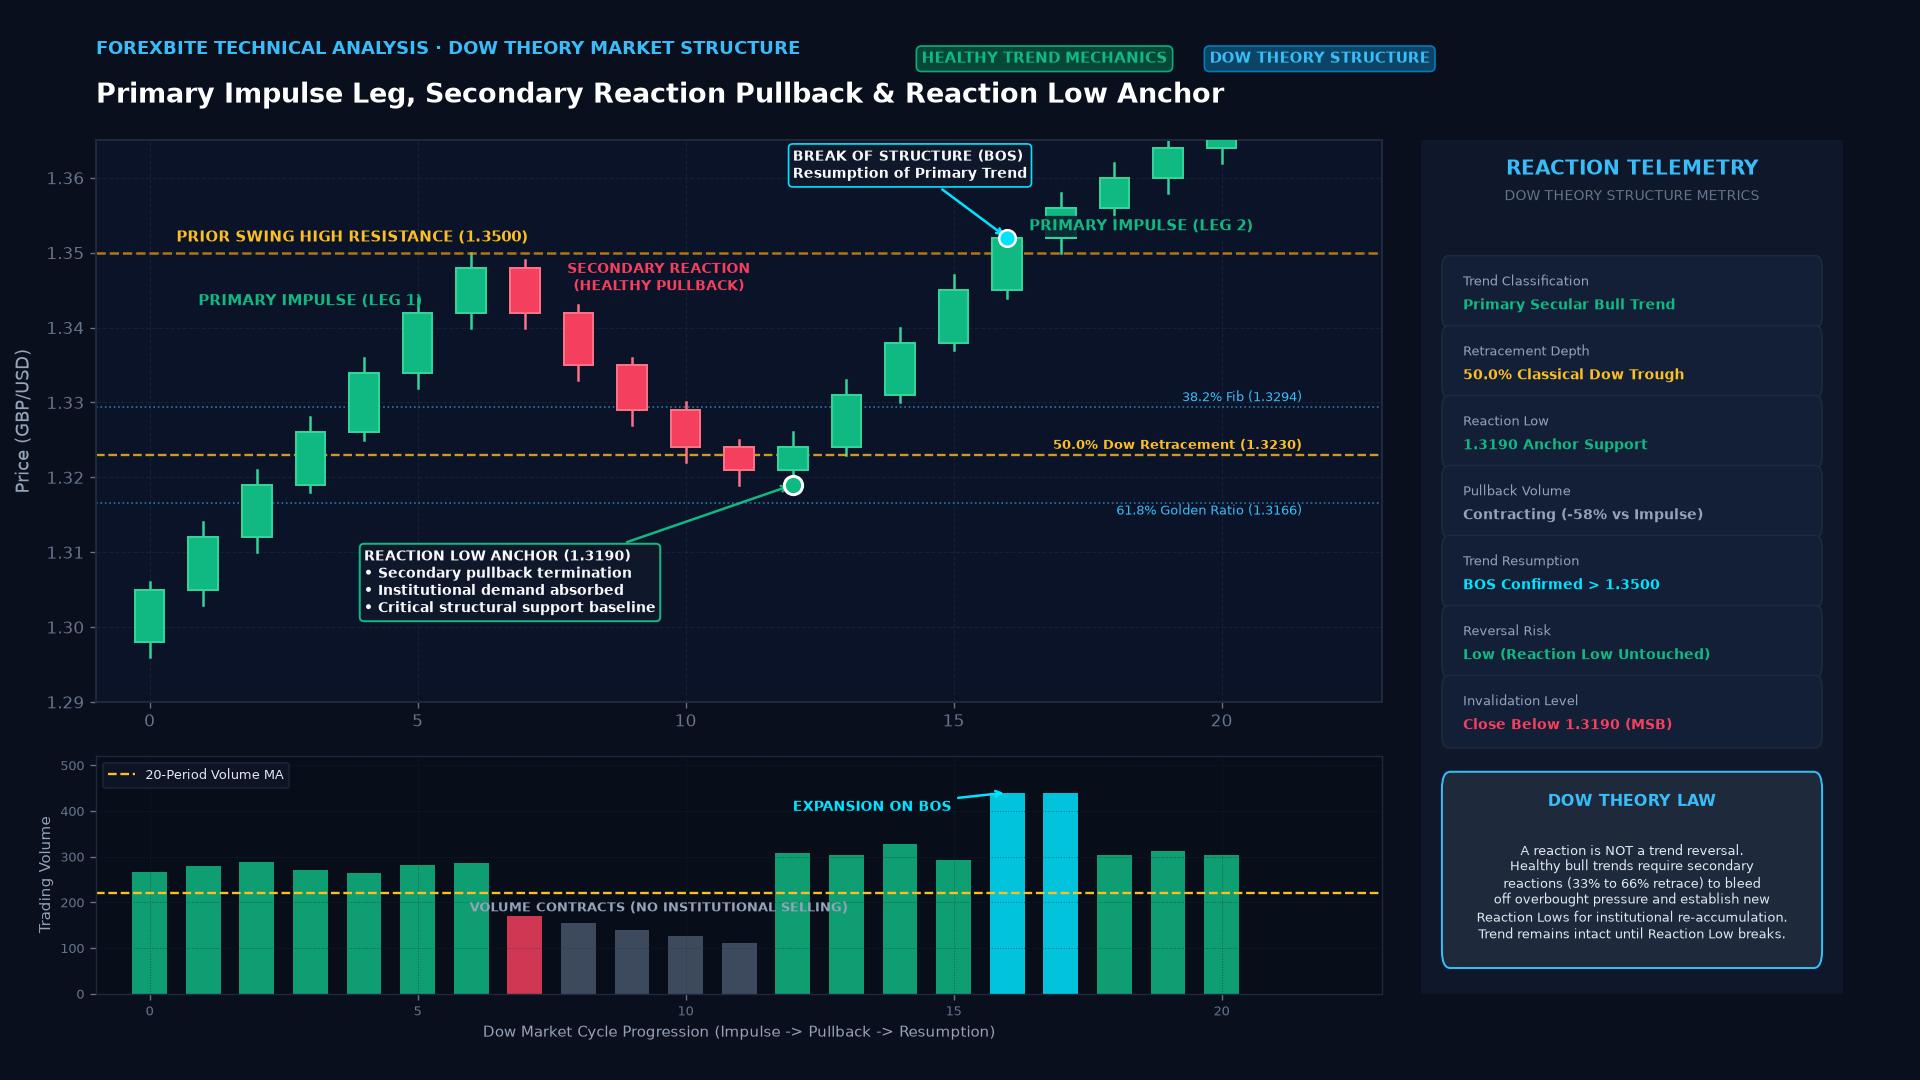 Figure: Dow Theory market structure illustrating primary impulse waves, the secondary reaction pullback (50% retracement level), institutional Reaction Low anchor, and Break of Structure (BOS).
The Dow Theory Framework: Primary Trends vs. Secondary Reactions
Formulated by Charles Dow over a century ago, foundational market theory classifies all market price action into three concurrent movements:
- The Primary Trend: The broad, multi-year or multi-month secular direction of the market (Bull or Bear), representing the dominant macroeconomic tide.
- The Secondary Reaction (The Retracement): Counter-trend corrections that typically retrace one-third (33%) to two-thirds (66%)—most frequently 50%—of the preceding primary impulse leg, lasting from several weeks to several months.
- Minor Day-to-Day Fluctuation: Intraday noise and brief 1-to-3-day swings that carry zero predictive validity for long-term capital allocation.
Anatomy of Reaction Levels in Market Microstructure
In modern technical analysis, reaction extremes serve as foundational anchors for institutional order flow:
| Structural Landmark | Market Context | Microstructure Mechanics | Strategic Application |
|---|---|---|---|
| Reaction Low | Formed when a downward pullback in an uptrend bottoms and turns upward. | Represents the price where institutional buyers absorbed all available selling supply. | Becomes a critical Support Level. A break below a reaction low signals market structure failure (MSB). |
| Reaction High | Formed when an upward bounce in a downtrend tops out and resumes falling. | Represents the price where institutional sellers reloaded short positions. | Becomes a critical Resistance Level. Serves as the invalidation point for short setups. |
| Fibonacci Reaction Zone | Mathematical retracement measurement of the prior impulse leg. | Dense clusters of algorithmic limit orders rest at 38.2%, 50.0%, and 61.8% retracement levels. | High-probability entry zones to join the primary trend at discounted pricing. |
       FIBONACCI REACTION RETRACEMENT LEVELS

  Swing High: $1.1000 ===================================== (0.0% Retracement)
                      \
                       \  [38.2% Reaction: $1.0884] ----> Shallow Trend Pullback
                        \
                         \  [50.0% Reaction: $1.0850] ----> Classical Dow Equilibrium
                          \
                           \  [61.8% Reaction: $1.0818] --> "Golden Pocket" Reversal
                            \
  Swing Low:  $1.0600 ===================================== (100% Invalidation)
Immediate News Reactions vs. Structural Reactions
Traders must distinguish between the initial emotional reaction to breaking fundamental news and subsequent structural market developments:
1. The Immediate Knee-Jerk News Reaction
Occurs within the first 1 to 5 minutes of a major economic release (e.g., US Non-Farm Payrolls or central bank rate statement). Driven by automated news-scraping algorithms, bid-ask spreads blow out, and price spikes violently. This initial knee-jerk reaction is frequently erratic, false, or immediately reversed (“whipsaw”) as human desks digest the full contextual report.
2. The Secondary Structural Reaction
Occurs 30 to 60 minutes after the news release, once liquidity providers stabilize their books. This secondary move reflects genuine institutional capital repositioning based on the revised economic outlook, establishing the true trend for the remainder of the session.
Real-World Case Study: Reaction Low Formation on GBP/USD
In late September 2022, following the UK “Mini-Budget” crisis, GBP/USD staged an extraordinary capitulation collapse, printing an all-time record low of 1.0350 before the Bank of England intervened.
- The Primary Advance: Over the subsequent eight weeks, emergency fiscal reversals and dollar softening propelled GBP/USD in a powerful 1,700-pip rally to a high of 1.2050 in late November.
- The Downward Reaction: At 1.2050, buyers became exhausted, and short-term CTAs initiated aggressive profit taking. Over the next ten days, GBP/USD experienced a sharp downward reaction, pulling back 260 pips.
- The Reaction Low: On November 21, the pullback found firm institutional buying directly at 1.1780—aligning perfectly with the 50.0% Fibonacci retracement of the preceding leg and prior horizontal resistance converted to support.
- Trend Resumption: The reaction terminated, and GBP/USD exploded higher, breaking through 1.2050 and continuing its macro rally toward 1.2450. Traders who recognized 1.1780 as an orderly reaction low rather than a trend reversal captured over 600 pips of upside.
Frequently Asked Questions
What is the difference between a reaction and a reversal?
- A reaction is a temporary counter-trend retracement that leaves the broader market structure intact (e.g., price pulls back but does not break below the previous major swing low).
- A reversal represents a permanent breakdown of the existing trend, characterized by a structural break of market structure (printing lower highs and lower lows) that initiates an entirely new trend.
How do I identify when a reaction is ending?
Technical traders look for multiple confirmation signals that a reaction is concluding, including: price touching a key Fibonacci support level (e.g., 50% or 61.8%), momentum oscillators (like RSI) curling upward out of oversold territory, and the appearance of bullish rejection candlestick patterns (such as a Hammer or Bullish Engulfing candle).
Why do seasoned traders prefer entering on reactions rather than breakouts?
Entering on a reaction allows a trader to “buy the dip” at a favorable wholesale discount price, significantly improving their risk-reward ratio. It enables placement of a tight stop-loss just behind the confirmed structural support level, whereas chasing a breakout at the top of a green candle forces a wider stop-loss and exposes the trade to instant pullback drawdown.
Ready to trade forex?
Open a free demo account with a regulated broker. Practice with virtual funds before risking real money.