Rally
A rally is a period of sustained upward price movement in an individual asset, currency pair, or broader financial market, characterized by persistent buying pressure, expanding volume, and the printing of consecutive higher highs and higher lows.
What Is a Rally?
In financial market technical analysis, a rally is a distinct phase of rapid and sustained capital appreciation where buying pressure decisively outstrips available selling liquidity. During a rally, prices surge upward across consecutive trading sessions, clearing local resistance levels and generating expanding market breadth.
A rally can manifest in two contrasting market regimes:
- Bull Market Rally (Trend Continuation): Occurs within an established long-term macro uptrend, propelled by expanding economic growth, corporate earnings beats, or favorable monetary easing. These rallies tend to be orderly, durable, and supported by broad institutional accumulation.
- Bear Market Rally (Counter-Trend / Relief Rally): Occurs during an ongoing secular downtrend. Driven by violent short-covering and capitulation exhaustion, bear market rallies are typically explosive, sharp, and deceptive (often described as a “dead-cat bounce” or “sucker’s rally”), before failing at major resistance and resuming the broader macro decline.
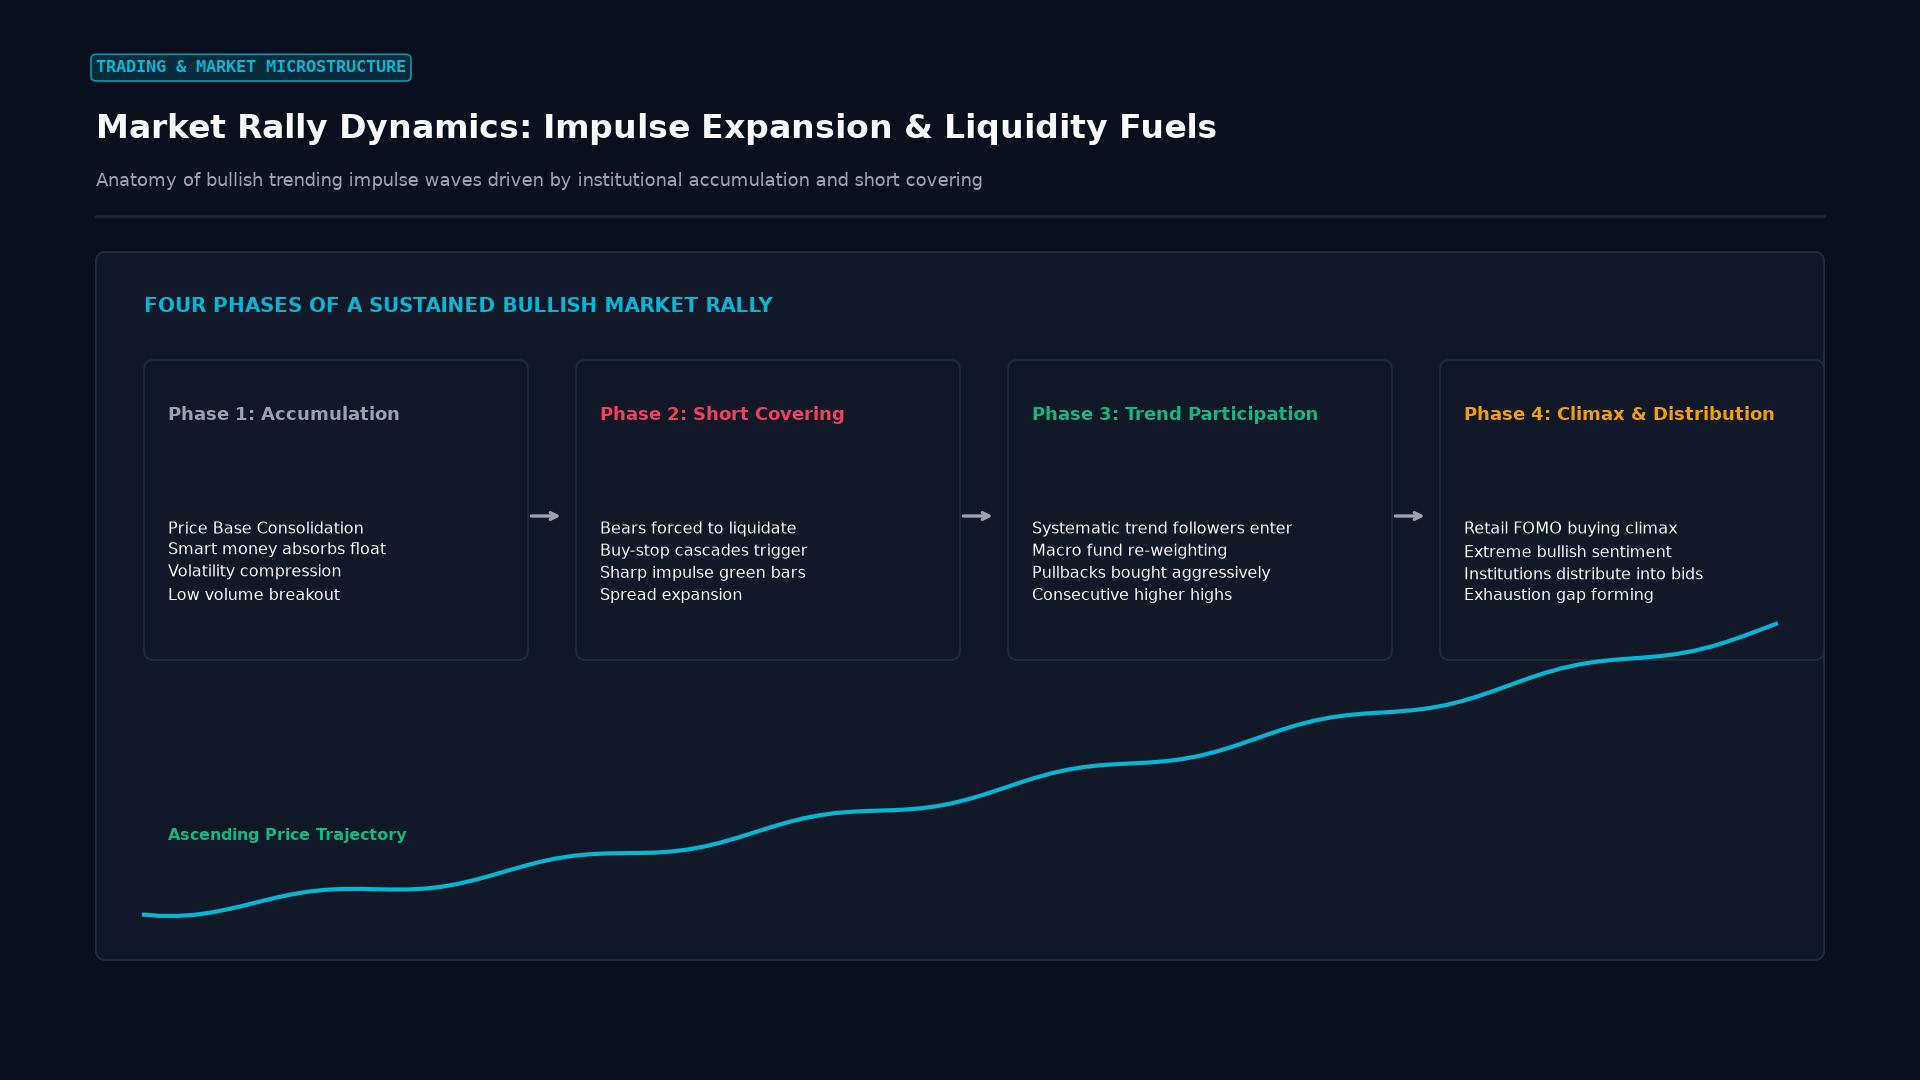 Figure: Four stages of a market rally: smart money accumulation, short covering cascades, broad trend participation, and retail buying climax.
Anatomy of a Market Rally: Three Distinct Phases
Institutional quantitative analysts identify three sequential stages in the evolution of a classic market rally:
1. The Accumulation Phase (Smart Money Inflow)
Occurs after an extended sell-off or prolonged base consolidation. Institutional investors and algorithmic value funds quietly absorb shares and currency blocks without moving the price. Public sentiment remains overwhelmingly pessimistic, and volatility compresses.
2. The Participation Phase (Momentum Expansion)
Price decisively breaks out above key structural resistance levels and major moving averages (e.g., the 50-day and 200-day EMAs). Trend-following CTAs, retail traders, and momentum algorithms enter the market. Volume expands dramatically, and the market prints consecutive strong bullish candlesticks.
3. The Distribution & Parabolic Blow-Off (Exhaustion)
Public media headlines turn euphoric (“FOMO” takes over). Retail margin debt surges, and technical oscillators (like RSI) become deeply overbought (> 80). Early institutional accumulators begin quietly distributing inventory to late retail buyers. The rally concludes with a climactic blow-off spike followed by aggressive profit taking.
Bull Rallies vs. Bear Market Rallies: Key Differences
Discretionary and systematic traders differentiate between genuine trend continuations and deceptive counter-trend spikes:
| Structural Feature | Genuine Bull Market Rally | Bear Market Rally (Relief Bounce) |
|---|---|---|
| Primary Driver | Fundamental economic growth, liquidity expansion, earnings beats. | Sudden short-covering panic, margin liquidations of bears. |
| Velocity & Slope | Steady, measured 45-degree angle of ascent. | Violent, near-vertical spikes (+5% to +15% within days). |
| Volume Characteristics | Heavy volume on up-days; light volume on pullbacks. | Surges on the initial short squeeze; rapidly dries up near resistance. |
| Market Breadth | High; widespread participation across cyclical and value sectors. | Narrow; concentrated in heavily shorted or distressed “junk” assets. |
| Higher-Timeframe Trend | Trading above rising 50-day and 200-day moving averages. | Trading below a downward-sloping 200-day moving average. |
| Outcome | Establishes durable multi-month higher highs. | Terminates abruptly, leading to lower lows. |
Specialized Rally Archetypes in Financial Markets
- The Santa Claus Rally: A recurring seasonal calendar anomaly in US equity markets where the S&P 500 historically gains an average of 1.3% over the final five trading days of December and the first two trading days of January, driven by holiday bonuses, tax-loss harvesting cessation, and institutional window-dressing.
- The Short-Covering Squeeze Rally: Occurs when an asset with heavy short interest suddenly receives positive news. As short-sellers rush to buy back contracts to cut losses, their market buy orders trigger automated stop-losses, fueling an explosive parabolic price surge.
- The Dollar Smile Rally: Occurs in foreign exchange when the US Dollar rallies under two polar opposite conditions: either during booming US economic outperformance (cyclical rally) or during severe global geopolitical and financial panics (safe-haven flight-to-safety rally).
Real-World Case Study: The Epic Bear Market Rally of March–August 2008
Following the emergency collapse of Bear Stearns in March 2008, global markets temporarily stabilized as the Federal Reserve introduced liquidity backstops:
- The S&P 500 Relief Rally: Between March 10 and May 19, 2008, the S&P 500 staged a massive 12.5% rally, surging from 1,273 to 1,440.
- The Trap: Financial commentary proclaimed that the subprime mortgage crisis was “contained” and that a new bull market was underway. Retail buyers rushed into banking stocks.
- The Failure: The rally failed directly at the downward-sloping 200-day moving average on diminishing volume, revealing that institutional distribution was underway.
- The Aftermath: When credit contagion hit Fannie Mae, Freddie Mac, and Lehman Brothers in September 2008, the market collapsed over 50%, demonstrating that bear market rallies are treacherous traps for unhedged investors.
       THE 2008 BEAR MARKET RALLY TRAP

 [March 2008: Bear Stearns Bailout] ---> S&P 500 at 1,273
                                            |
                                            v (Violent +12.5% Relief Rally)
 [May 2008: Peak of Relief Rally]   ---> S&P Hits 1,440 (Fails at 200 EMA)
                                            |
                                            v (Secular Downtrend Resumes)
 [Sept 2008: Lehman Brothers Fails] ---> S&P Plummets to 666 (-54% Crash)
Frequently Asked Questions
What technical indicators confirm a genuine rally?
Traders look for expanding volume on bullish candles, moving average alignment (e.g., 20-day EMA trading above the 50-day EMA), and the Moving Average Convergence Divergence (MACD) crossing above the zero centerline with expanding positive histogram bars.
How should a trader enter an ongoing rally without chasing the top?
Professional traders avoid buying at the extreme tip of a green candle. Instead, they wait for an orderly pullback to key moving average support (such as the 8-day or 21-day EMA) or a retest of a broken horizontal resistance level (converting resistance into support) before entering with defined risk.
What is a “relief rally”?
A relief rally is a sharp, short-term upward price bounce that occurs after a period of intense selling or panic, caused when an anticipated catastrophic event turns out to be less severe than feared (e.g., an economic data release printing slightly better than worst-case forecasts).
Ready to trade forex?
Open a free demo account with a regulated broker. Practice with virtual funds before risking real money.