Rounding Top and Bottom
Classical technical reversal chart patterns characterizing a gradual, multi-session transition in market control from buyers to sellers (rounding top) or from sellers to buyers (rounding bottom), identified by a parabolic price curve and a corresponding U-shaped volume profile.
What Are Rounding Tops and Bottoms?
In technical analysis, rounding tops (often called inverted saucers or dome patterns) and rounding bottoms (saucers or bowl patterns) are classical long-term reversal formations. Unlike violent V-shaped reversals or abrupt head-and-shoulders patterns, rounding formations represent a slow, methodical transfer of supply and demand across extended timeframes.
- A Rounding Bottom forms after an extended downtrend. The selling momentum progressively dissipates until prices drift sideways in a low-volatility basing phase. Gradually, institutional accumulation absorbs floating supply, curling prices upward until the market breaks out above a critical overhead resistance level (the neckline).
- A Rounding Top develops at the culmination of a mature bull market. Buying enthusiasm wanes gradually as institutional distribution replaces aggressive bidding. The price trajectory curves into a smooth dome, establishing a distribution plateau before accelerating downward through key baseline support.
Because these patterns require extensive structural development, they are most reliable on daily, weekly, and monthly charts where institutional accumulation and distribution cycles play out over months or years.
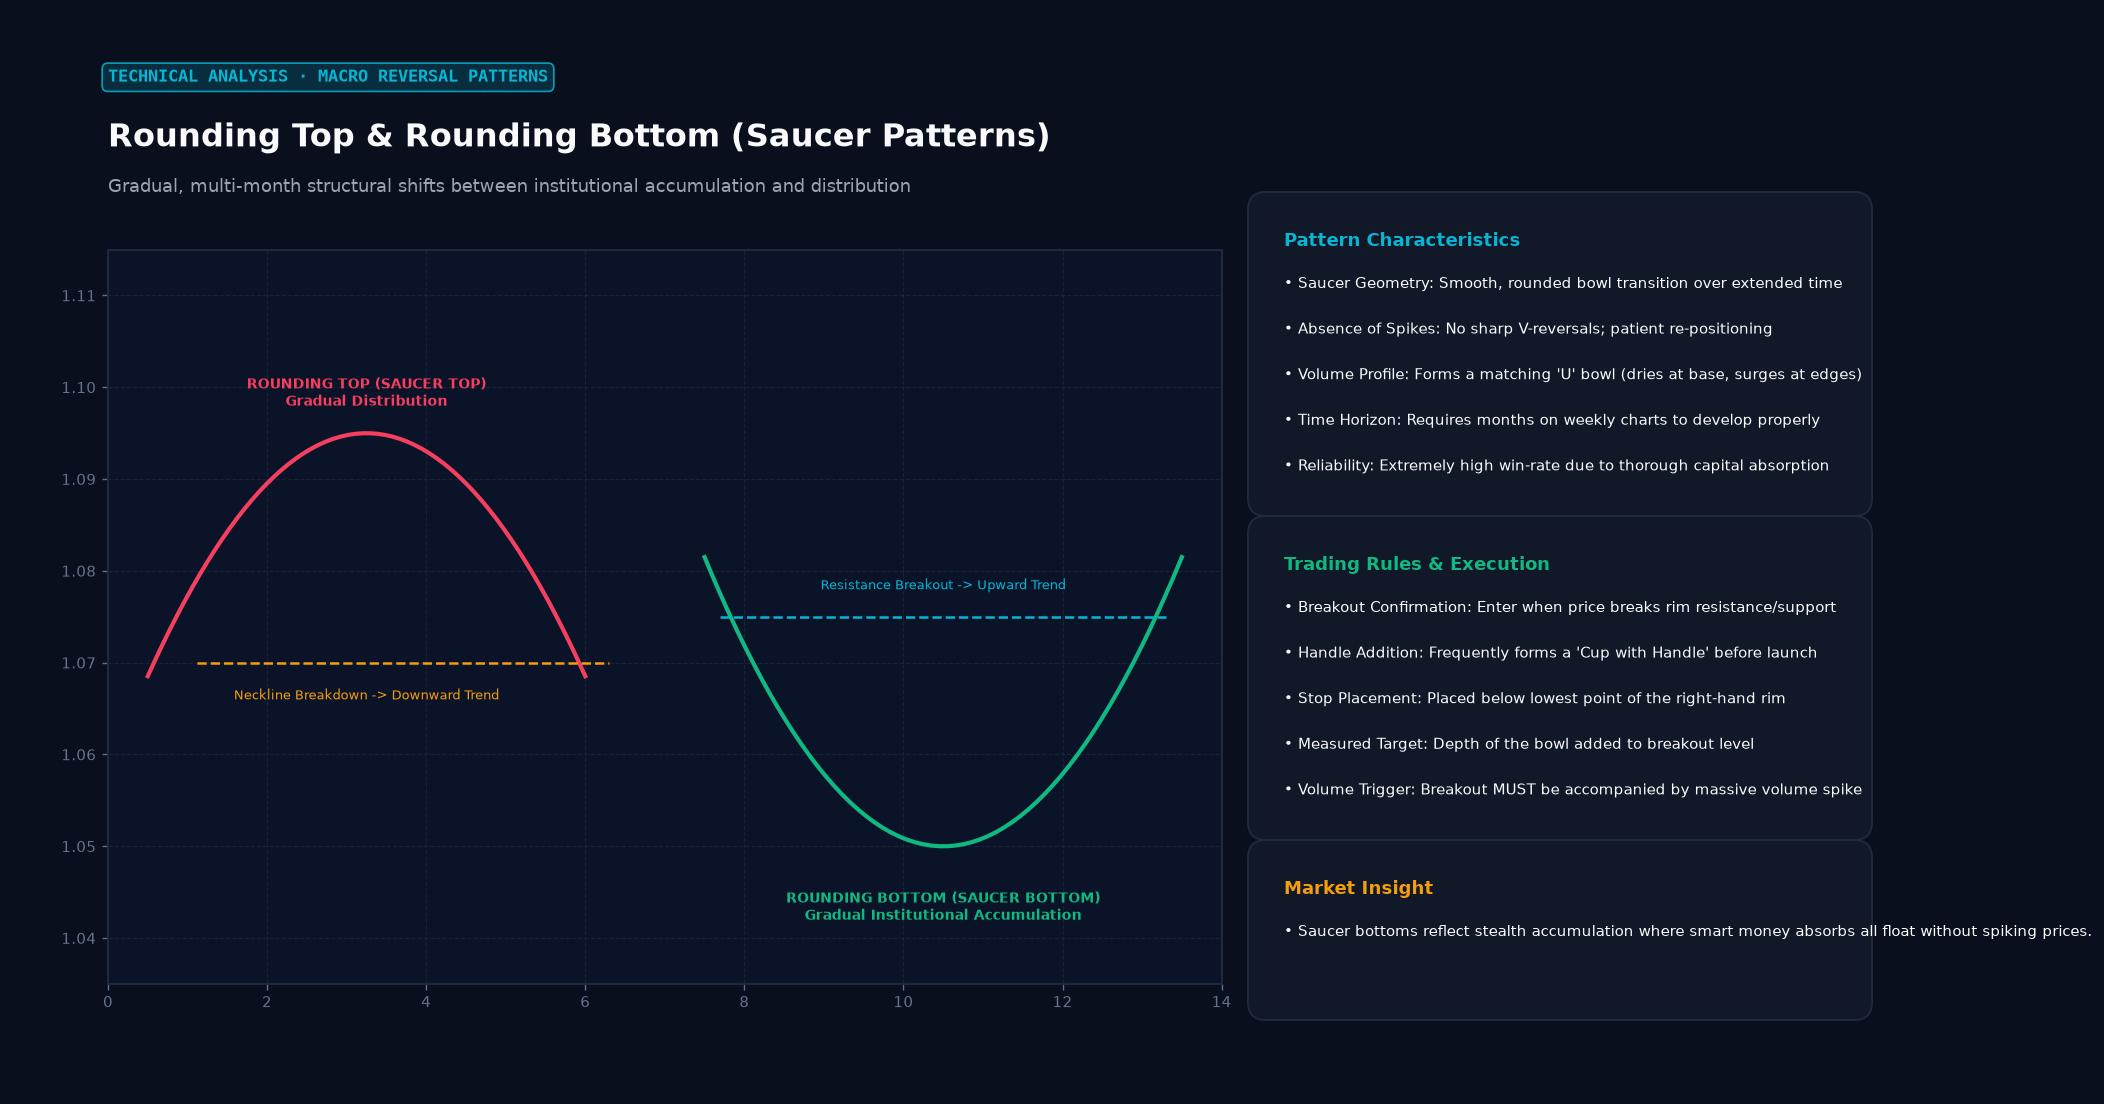 Figure: Gradual, multi-month structural shifts between institutional accumulation and distribution
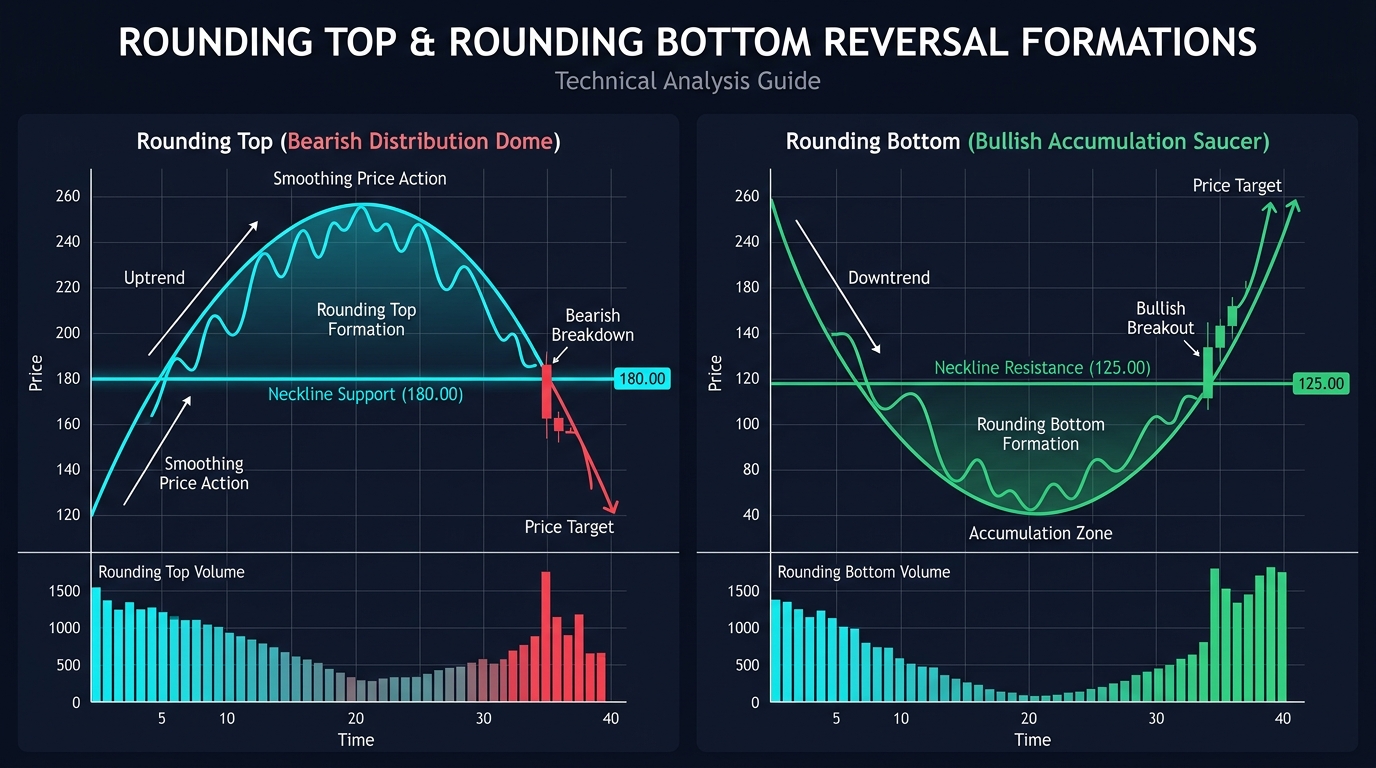
The U-Shaped Volume Signature
A defining characteristic of genuine rounding formations is the volume curve, which typically mirrors or complements the price curvature. Without volume confirmation, curved price formations often degenerate into erratic consolidation ranges.
       ROUNDING BOTTOM PRICE & VOLUME CORRELATION

 Price:   \                                           /  (Breakout)
           \                 Basing Phase            /
            '-._           _.-'''''-._           _.-'
                `'''''''''`           `'''''''''`
 ─────────────────────────────────────────────────────────────
 Volume:  |||||                                    ||||||||
          ||||                                      ||||||
          |||          | |   |  |   | |              ||||
Downtrend Low-Volume Base Breakout Surge- The Entry Leg: As the prior trend approaches its late stages, trading volume remains elevated as the final wave of momentum traders enters the market.
- The Basing / Apex Phase: In the center of the formation, price velocity grinds to a halt. Volatility compresses, and trading volume drops to multi-month lows as both buyers and sellers reach a temporary equilibrium. Institutional participants quietly absorb supply without moving prices.
- The Exit Leg & Breakout: As the new trend establishes dominance, volume progressively expands. When price pierces the horizontal neckline, trading volume spikes dramatically, confirming institutional sponsorship and triggering momentum breakout systems.
Mathematical Target Projection: The Measured Move
Technical analysts utilize the height of the rounding pattern to project objective minimum price targets upon breakout:
Pattern Height (H) = | Neckline Price - Extreme Crest/Trough Price |1. Bullish Target Calculation (Rounding Bottom)
$$\text{Target Price} = \text{Neckline Resistance} + H$$
Assume a currency pair carves out a rounding bottom on the daily chart:
- Neckline Resistance: 1.1000
- Lowest Trough of the Bowl: 1.0500
- Pattern Height ($H$): $1.1000 - 1.0500 = 0.0500$ (500 pips)
- Minimum Measured Target: $1.1000 + 0.0500 = \mathbf{1.1500}$
2. Bearish Target Calculation (Rounding Top)
$$\text{Target Price} = \text{Neckline Support} - H$$
Assume an equity index develops an inverted saucer:
- Neckline Support: 4,500
- Apex of the Dome: 4,850
- Pattern Height ($H$): $4,850 - 4,500 = 350$ points
- Minimum Downside Target: $4,500 - 350 = \mathbf{4,150}$
Rounding Bottom vs. Rounding Top vs. Cup and Handle
| Attribute | Rounding Bottom (Saucer) | Rounding Top (Dome) | Cup and Handle |
|---|---|---|---|
| Market Bias | Strongly Bullish (Reversal) | Strongly Bearish (Reversal) | Bullish (Continuation or Reversal) |
| Prior Trend | Sustained Downtrend | Extended Uptrend | Uptrend or early recovery stage |
| Structure | Single symmetrical bowl | Single symmetrical inverted dome | Rounded bowl followed by a downward-sloping pullback handle |
| Confirmation Point | Daily close above neckline resistance | Daily close below neckline support | Daily close above handle resistance line |
| Average Duration | Several months to multiple years | Several weeks to several months | 7 weeks to 65 weeks |
| Failure Rate | Relatively low if volume confirms | Moderate (often prone to erratic whipsaws) | Extremely low in strong secular bull markets |
Real-World Institutional Case Study: Gold (XAU/USD) Multi-Year Rounding Bottom (2013–2019)
One of the cleanest macroeconomic rounding bottoms in modern market history developed in Spot Gold (XAU/USD) between late 2013 and mid-2019 following the post-2011 commodity crash.
       XAU/USD MULTI-YEAR ROUNDING BOTTOM (2013–2019)

 $1,400 ───┐                                          ┌─── Breakout ($1,375)
           │\                                        /│
 $1,300 ───┼─\                                      /─┼──
           │  \                                    /  │
 $1,200 ───┼───\                                  /───┼──
           │    \___                          ___/    │
 $1,100 ───┼────────\________________________/────────┼── Low: $1,046 (Dec 2015)
           └──────────────────────────────────────────┘
2013 2014 2015 2016 2017 2018 2019- Formation Anatomy: Gold plunged from $1,800 to $1,200 in 2013, eventually carving out an absolute cyclical bottom at $1,046 in December 2015.
- The Accumulation Plateau: Over the next four years, gold carved out a symmetrical basing bowl with major overhead resistance anchored at the $1,375 neckline.
- Volume and Volatility Compression: Between 2017 and late 2018, daily trading volume dwindled, and monthly volatility compressed to decade lows.
- The Breakout Execution: In June 2019, amid dovish Federal Reserve policy pivots, Gold surged through the $1,375 neckline on massive global institutional volume.
- Outcome: Applying the measured move formula ($H = $1,375 - $1,046 = $329$), the theoretical target was $$1,375 + $329 = \mathbf{$1,704}$. Gold easily surpassed this projection, surging without a retest to an all-time high of $2,075 by August 2020.
Tactical Trading Strategies: Entering Rounding Formations
Professional traders utilize two primary entry methodologies to participate in rounding reversals while strictly controlling downside risk:
1. The Aggressive Breakout Entry
- Trigger: Enter immediately upon a decisive candle close beyond the neckline, verified by above-average trading volume.
- Stop-Loss: Placed below the breakout candle or the midpoint of the final leg.
- Advantage: Guarantees participation in fast-moving runaway markets that never offer a pullback.
2. The Conservative Retest Entry
- Trigger: Wait for the breakout to occur, followed by a low-volume retracement back to test the former neckline (resistance turning into support).
- Stop-Loss: Placed snugly below the newly formed swing low.
- Advantage: Provides a vastly superior risk-reward ratio, although the trader risks missing the trade if no retest materializes.
Frequently Asked Questions
Can rounding patterns be identified on intraday timeframes (e.g., 5-minute charts)?
While curved intraday formations frequently appear on algorithmic feeds, genuine institutional rounding tops and bottoms require significant capital accumulation and distribution. On 5-minute or 15-minute charts, curved patterns are prone to false breakouts caused by high-frequency liquidity vacuums. They are most dependable on 4-hour, daily, and weekly charts.
What causes a rounding bottom to fail?
A rounding pattern fails when the price reaches the neckline resistance but encounters heavy institutional supply, rejecting downward back into the bowl. If price drops below the midpoint of the bowl, the pattern is invalidated, signaling that the basing phase was merely a continuation pause rather than a genuine macroeconomic reversal.
How does a rounding bottom differ from an inverse head-and-shoulders pattern?
Both patterns are bullish reversals. However, an inverse head-and-shoulders pattern consists of three distinct troughs (a deep head flanked by two higher shoulders) formed by aggressive, reactive swings. A rounding bottom features a continuous, smooth curvature without distinct shoulder peaks, reflecting a much slower, gradual transition in market psychology.
Ready to trade forex?
Open a free demo account with a regulated broker. Practice with virtual funds before risking real money.