Head and Shoulders
The Head and Shoulders pattern is one of the most reliable reversal formations in technical analysis. It consists of three peaks: a left shoulder, a higher central peak (the head), and a right shoulder matching the left's height. A break below the neckline — the trendline connecting the pattern's troughs — signals the completion of the bearish reversal.
Why the Head and Shoulders Pattern Commands Respect
Technical analysis has hundreds of named patterns. Most are marginally useful at best. The Head and Shoulders stands apart because its structural logic is sound: it describes a specific sequence of momentum shifts that can be verified independently with volume, indicator confirmation, and market context.
When Thomas Bulkowski conducted the largest statistical study of chart patterns in his Encyclopedia of Chart Patterns (covering thousands of historical formations), the Head and Shoulders consistently ranked among the top performers for reliability and profit potential. That reputation is earned over decades of real market data.
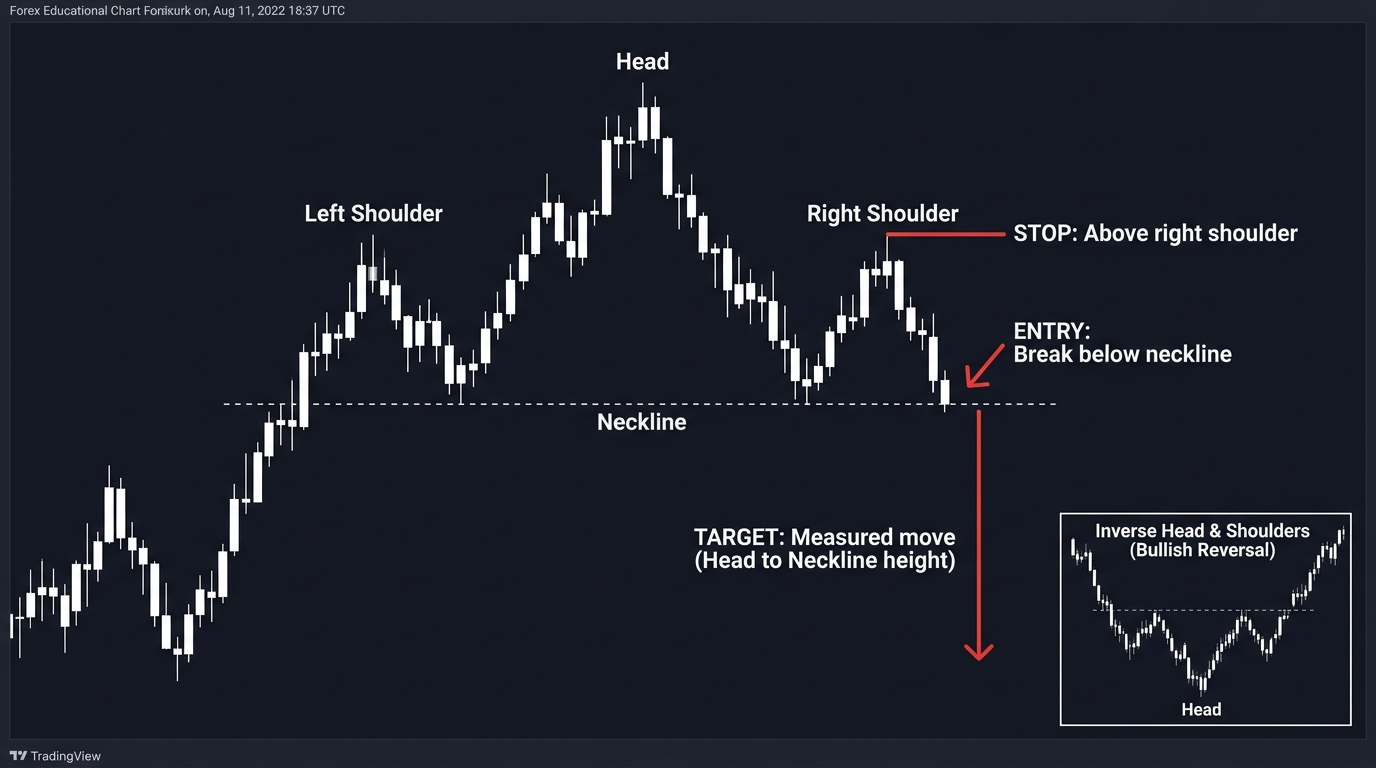
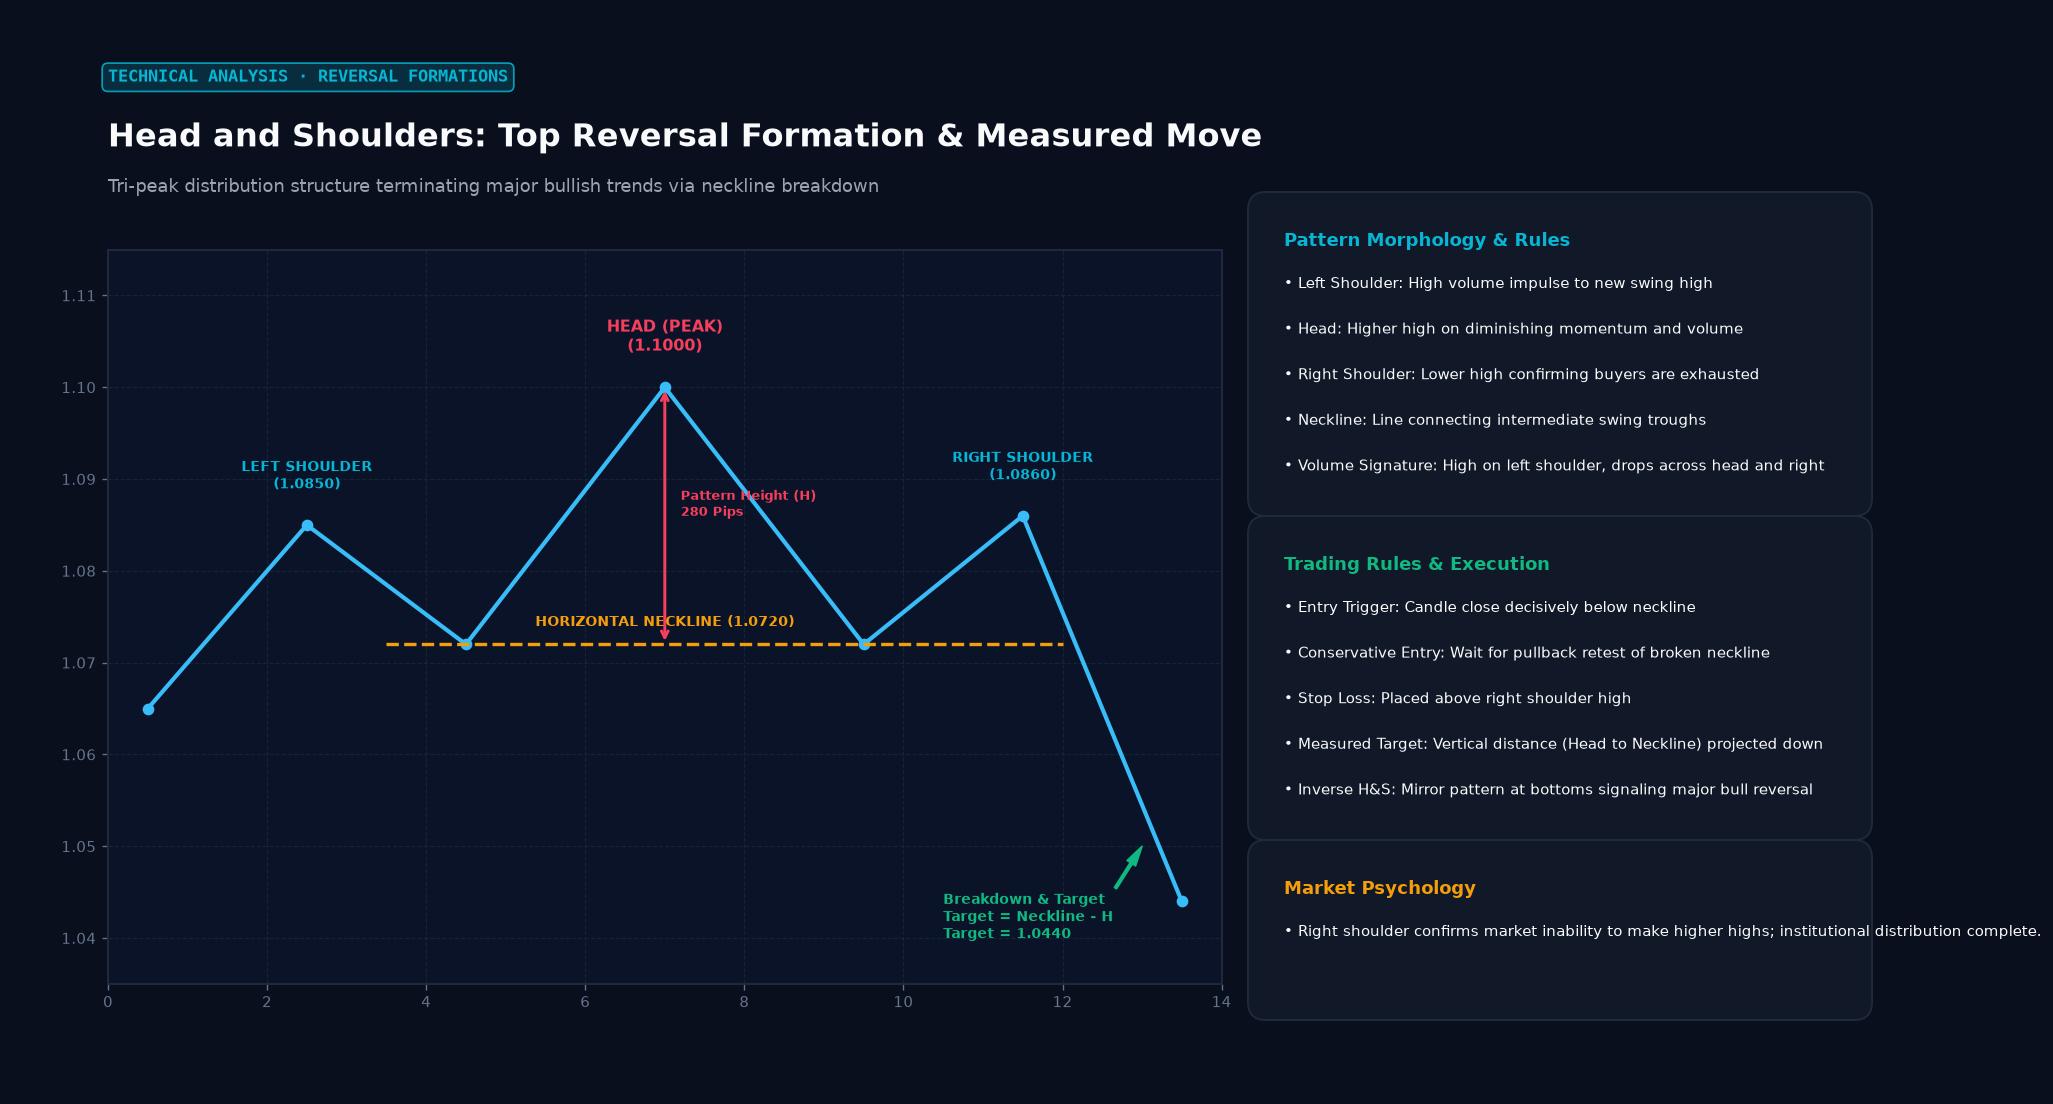 Figure: Tri-peak distribution structure terminating major bullish trends via neckline breakdown
Structure and Formation
The pattern develops in a clear sequence:
Left Shoulder: Price rallies to a peak, then pulls back. This peak is an ordinary high — at the time, it looks like a normal consolidation. Volume is typically moderate to high during the rally.
Head: After the left shoulder pullback, price rallies again — this time to a new high that exceeds the left shoulder peak. This is the head. Volume during the head formation is often lower than during the left shoulder, which is the first warning signal: new highs made with diminishing volume reflect weakening buying conviction.
Right Shoulder: Price declines from the head and rallies a third time, but now it fails to reach the head’s height. The right shoulder peak forms at roughly the same level as the left shoulder. Volume during the right shoulder rally is typically the lowest of the three peaks — buyers are genuinely exhausted.
Neckline: The line connecting the low of the left shoulder pullback and the low between the head and right shoulder. This may be horizontal or slightly ascending or descending. The neckline is the critical trigger level.
The Neckline Break: Entry Signal
When price falls through the neckline after completing the right shoulder, the pattern is confirmed. This is the entry trigger for traders acting on the formation.
Price target: The measured move from the neckline to the top of the head, projected downward from the neckline break. If the head is 150 pips above the neckline, the target is 150 pips below the neckline.
Stop-loss placement: Above the right shoulder peak. If price re-establishes itself above the right shoulder, the pattern has failed.
Some traders wait for a neckline retest — price breaks below the neckline, then pulls back up to test it as new resistance before continuing lower. This offers a better risk-reward entry but comes with the risk of missing the move if the retest doesn’t happen.
Volume Confirms the Pattern
The ideal Head and Shoulders unfolds with a specific volume signature:
- High volume on the left shoulder rally
- Moderate volume on the head rally (declining)
- Low volume on the right shoulder rally
- Expanding volume on the neckline break
Volume divergence during the head formation (new price high, declining volume) is the first confirmation that the underlying trend is losing participation. When sophisticated traders see this developing, they begin reducing long exposure before the neckline even breaks.
In forex, pure volume data is unavailable (no centralized exchange), so tick volume — the number of price changes per bar — is used as a proxy. It’s imperfect but directionally useful.
The Inverse Head and Shoulders: Bullish Reversal
The same pattern inverted marks a bullish reversal at market lows. Three troughs form: left shoulder (moderate low), head (deeper low), right shoulder (higher low matching the left shoulder’s level). The neckline connects the highs between the troughs.
A break above the neckline after the right shoulder confirms the bullish reversal. The measured target is the same: distance from neckline to the head’s low, projected upward from the breakout.
Common Failures and False Signals
Head and Shoulders patterns fail more often than textbooks suggest — Bulkowski’s research showed failure rates in the 20-40% range for various conditions. The most common causes:
Neckline too shallow: A very shallow, flat neckline produces more frequent false breaks.
Asymmetric shoulders: When the right shoulder is significantly higher than the left, the pattern is less reliable — it may indicate the uptrend is strong enough to continue rather than reverse.
Strong trend context: Reversal patterns are less reliable when the preceding trend is exceptionally strong and well-established. Against the primary trend, they fail more.
Key Takeaways
- Three peaks: left shoulder, head (highest), right shoulder (matching left height)
- Neckline break below confirms the bearish reversal
- Price target = head-to-neckline distance, projected below neckline
- Volume should diminish from left shoulder through head to right shoulder
- Inverse Head and Shoulders (inverted pattern) signals bullish reversals at lows
FAQ
How long does a Head and Shoulders pattern take to form? It varies enormously. On daily charts, the pattern may develop over 2–6 months. On hourly charts, it might complete in a few days. The significance of the pattern scales with the timeframe — a daily-chart H&S represents a much larger structural shift than an hourly one.
Can I trade the Head and Shoulders pattern in real time? Yes, but it requires patience. The pattern is only confirmed when the neckline breaks — entering during the right shoulder formation is anticipating the pattern, not trading it. Premature entries have a high failure rate because the right shoulder may extend further or the neckline may never break.
Ready to trade forex?
Open a free demo account with a regulated broker. Practice with virtual funds before risking real money.