Running a Position
The disciplined process of maintaining and actively managing an open market position to capture large macroeconomic trends, utilizing dynamic risk controls, trailing stops, and partial scale-outs rather than prematurely taking modest profits.
What Does “Running a Position” Mean?
In financial market parlance, running a position refers to holding an active, open exposure across multiple trading sessions, days, or months to exploit a sustained secular trend. Rather than closing out a profitable trade at the first sign of consolidation, an institutional or professional trader chooses to “let the winner run,” dynamically managing risk parameters to extract maximum capital gains.
Running a position is the practical execution of Wall Street’s oldest maxim: “Cut your losses short and let your winners run.” While straightforward in theory, executing this strategy requires overcoming severe psychological hurdles. Most market participants succumb to the disposition effect—the cognitive bias where traders eagerly liquidate profitable positions to lock in small psychological wins while stubbornly holding losing positions in the irrational hope of a rebound. Professional position management reverses this behavior entirely.
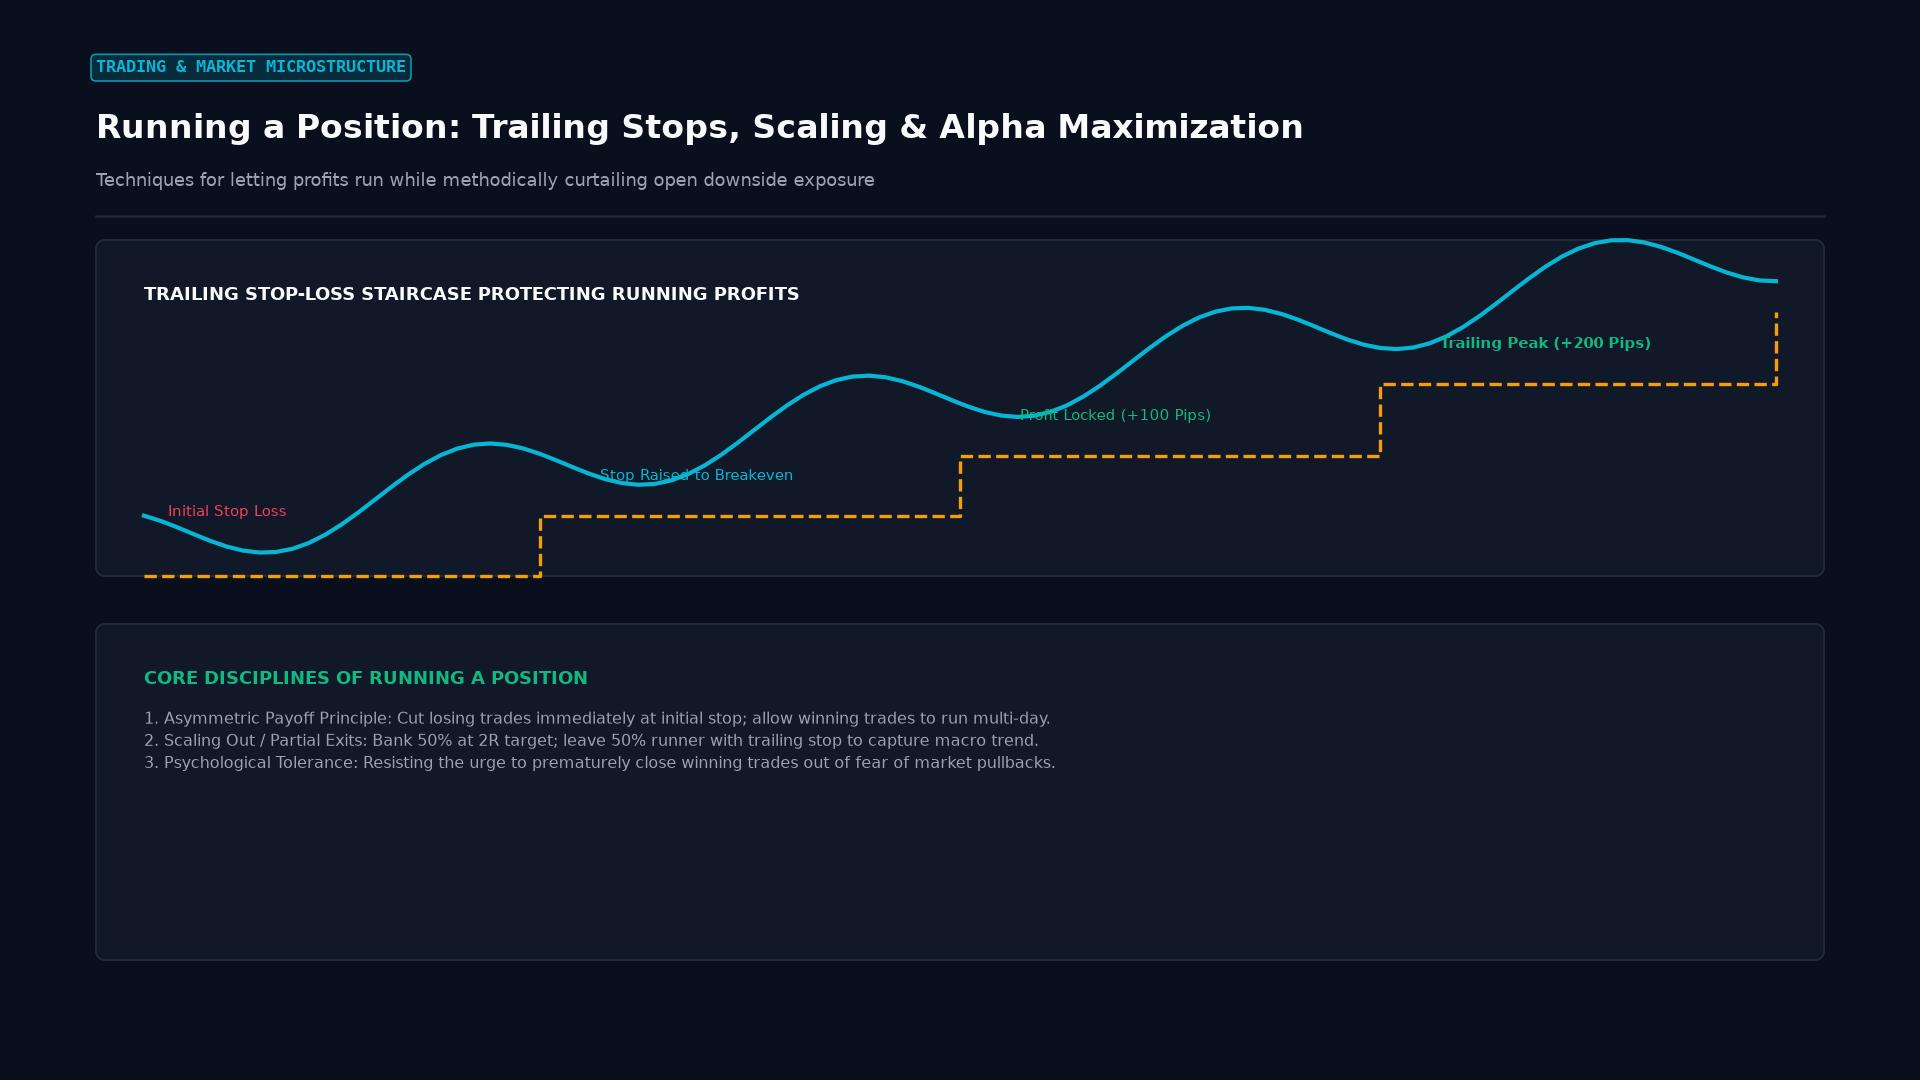 Figure: Trade management framework: trailing stop staircases, partial profit targets, and protecting floating capital while riding multi-day trends.
Tactical Tools for Managing a Running Position
Allowing a trade to run does not mean passively ignoring it. Professional portfolio managers utilize systematic tools to balance profit expansion against the risk of sudden market reversals:
1. Volatility-Based Trailing Stops (Chandelier Exit / ATR Trailing)
Rather than placing arbitrary pip-based stops, traders anchor their stops to market volatility using the Average True Range (ATR):
$$\text{Trailing Stop Level} = \text{Highest High Since Entry} - (k \times \text{ATR}_{14})$$
Where $k$ is a volatility multiplier (typically $2.5$ to $3.0$). As price rises, the trailing stop ratchets upward automatically, locking in accumulated gains while providing sufficient buffer to prevent premature stopped-out exits during normal intraday pullbacks.
2. Market Structure Stops (Swing Highs / Lows)
Under Dow Theory, an uptrend remains structurally sound as long as the market prints consecutive higher highs and higher lows. When running a long position, a trader trails their stop-loss just below each confirmed higher low swing. The position is liquidated only when the market structure breaks down.
3. Scaling Out (Partial Profit Taking)
To remove psychological anxiety while letting the core exposure run, traders often liquidate 30% to 50% of the position at an initial milestone (such as a major weekly resistance level or $2R$ profit target). The remaining runner is left active with a risk-free stop to capture potential runaway moves.
Running a Position vs. Day Trading vs. Buy-and-Hold Investing
| Operational Attribute | Running a Position (Trend Following) | Day Trading (Scalping / Intraday) | Buy-and-Hold (Passive Investing) |
|---|---|---|---|
| Holding Duration | Days, weeks, to multiple months | Minutes to hours; zero overnight exposure | Years to decades |
| Profit Potential | Massive asymmetric payoffs ($5R$ to $20R+$) | Consistent, modest pip gains ($1R$ to $2R$) | Long-term economic growth and dividends |
| Risk Management | Active trailing stops, structural exits | Tight stops, fixed session cutoffs | Generally unhedged; broad index exposure |
| Carrying Costs | Highly sensitive to overnight rollover/swaps | Zero swap fees; purely spread/commissions | Asset management fees, fund expense ratios |
| Psychological Demand | High (must endure pullbacks in unrealized gains) | High (requires intense focus and rapid decisions) | Low to moderate (passive tolerance of drawdowns) |
Real-World Institutional Case Study: Paul Tudor Jones and the 1987 Market Crash
One of the most celebrated examples of running a macro position in financial history was orchestrated by legendary hedge fund manager Paul Tudor Jones during the October 1987 stock market crash.
       DOW JONES INDUSTRIAL AVERAGE - OCTOBER 1987 COLLAPSE

 2,700 ──┐ (August Peak)
         │\
 2,500 ──┼─\___ (PTJ Identifies Breakdown & Initiates Short Position)
         │     \
 2,300 ──┼──────\___ (Runs Position: Adds to Winners / Trails Stops)
         │          \
 2,100 ──┼───────────\
         │            \
 1,700 ──┼─────────────\___ [ BLACK MONDAY: OCT 19, 1987 (-22.6%) ]
└────────────────────────────────────────────────────────- Macro Thesis: Jones and his quantitative strategist Peter Borish analyzed the historical valuation bubbles of 1929, identifying extreme structural leverage in portfolio insurance programs and unsustainable equity valuations.
- The Execution: Rather than scalping small pullbacks, Jones initiated heavy short positions in S&P 500 futures in early October.
- The Discipline to Run: When the market broke key technical supports on Friday, October 16, Jones did not cover his shorts to bank millions in quick profits. Recognizing that market liquidity was evaporating, he maintained his short exposure over the weekend.
- The Payoff: On Monday, October 19 (“Black Monday”), the Dow crashed 22.6% in a single session. By refusing to exit early and letting his massive short position run to its culmination, Tudor Investment Corp generated a historic 62% return for the month, earning over $100 million in net profit.
Operational Hazards: Managing the Risks of Running a Position
While running positions generates outsized long-term returns, market participants must insulate their portfolios against three structural hazards:
- Weekend Gap Risk: In the 24-hour foreign exchange market, trading halts from Friday 5:00 PM EST to Sunday 5:00 PM EST. If a sudden geopolitical crisis or emergency central bank rate decision occurs over the weekend, the market can gap past stop-loss orders, inflicting execution slippage.
- Overnight Rollover Erosion: If an investor runs a position against a wide negative interest rate differential (e.g., short USD/JPY during a Federal Reserve hiking cycle), cumulative rollover debits can steadily drain account capital, eroding the net profit of the trend.
- The Unrealized Drawdown Dilemma: In any 1,000-pip trend, the market will experience counter-trend pullbacks of 200 to 300 pips. A trader running a position must cultivate the emotional fortitude to watch thousands of dollars in unrealized mark-to-market profits temporarily vanish without panic-selling.
Frequently Asked Questions
What is the biggest mistake traders make when running a position?
The most damaging mistake is moving the stop-loss order too close to the current market price too early (over-tightening). By suffocating the trade during its initial development, normal market “noise” and liquidity sweeps will trigger the stop, ejecting the trader right before the massive trend unfolds.
How does negative carry affect running a currency position?
Negative carry acts as a constant tax on the trade. If holding a position incurs a -$15.00 nightly rollover debit, running that position for six months costs approximately $2,700 per lot in financing fees alone. Trend traders should prioritize currency pairs where the directional trade aligns with positive carry (earning a rollover credit).
Is running a position appropriate for traders with small accounts?
Yes, provided the position is sized conservatively using micro lots (0.01 lots). A trader with a $2,000 account can run a 0.02 lot position across a 500-pip trend, risking only $30 to $40 on the initial trade while aiming for a $100+ gain. The key requirement is matching lot size to the wide stop-loss distances required on daily and weekly charts.
Ready to trade forex?
Open a free demo account with a regulated broker. Practice with virtual funds before risking real money.