Simple Moving Average (SMA)
A fundamental technical analysis indicator that calculates the unweighted arithmetic mean of an asset's closing prices over a specified number of past periods, filtering out short-term market noise to reveal the underlying trend.
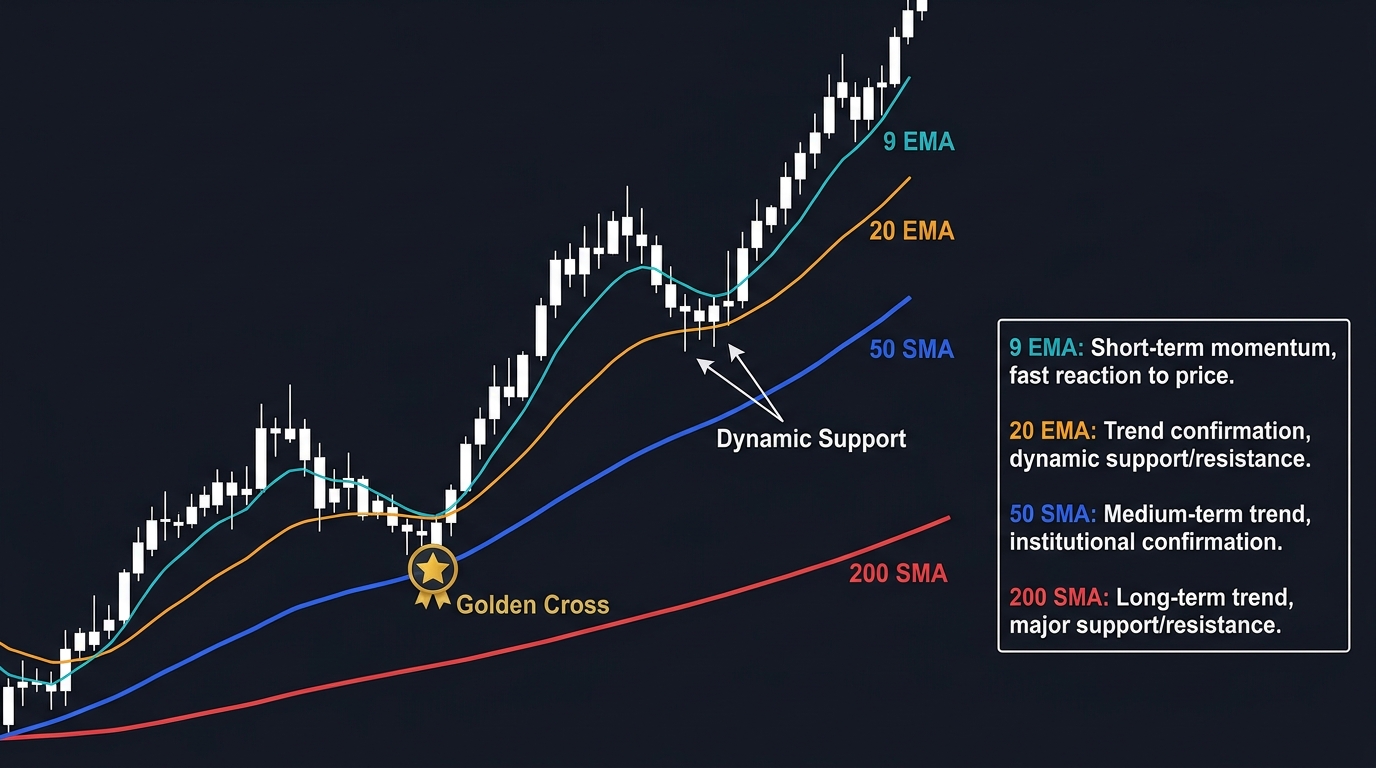
What Is a Simple Moving Average (SMA)?
The Simple Moving Average (SMA) is one of the most widely utilized and foundational indicators in financial technical analysis. It is an unweighted arithmetic calculation that averages an asset’s closing prices over a fixed number of lookback periods (bars or candlesticks), updating continuously as new data arrives.
By smoothing out erratic, high-frequency price fluctuations (“market noise”), the SMA provides an objective visual representation of whether an asset is in an uptrend, downtrend, or consolidation phase. Because it is computed strictly from historical prices, the SMA is an inherently lagging indicator—it does not predict market turns in advance, but rather confirms existing macroeconomic and institutional momentum shifts.
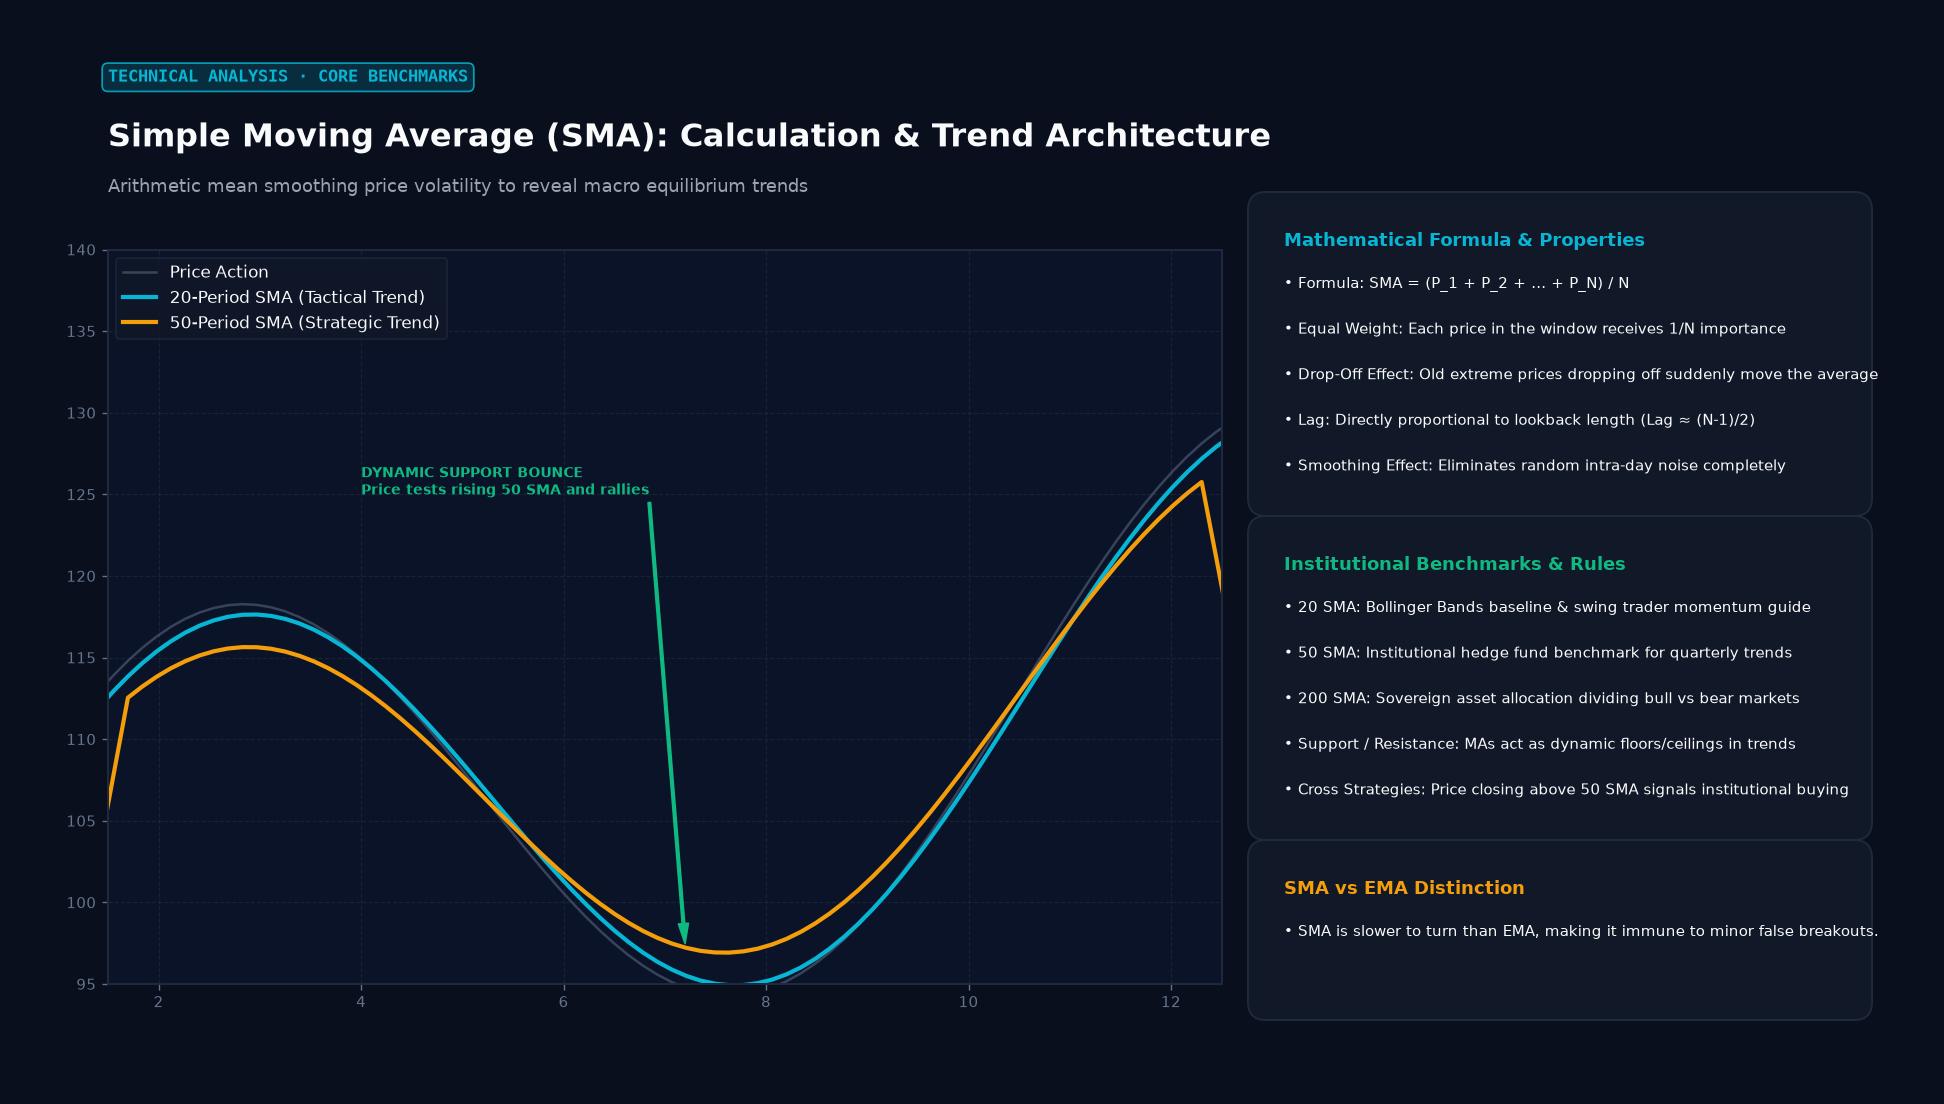 Figure: Arithmetic mean smoothing price volatility to reveal macro equilibrium trends
The Mathematical Formula of the Simple Moving Average
The mathematical calculation of an $n$-period Simple Moving Average is straightforward:
$$\text{SMA}t = \frac{1}{n} \sum{i=0}^{n-1} P_{t-i} = \frac{P_t + P_{t-1} + P_{t-2} + \dots + P_{t-(n-1)}}{n}$$
Where:
- $n$: The lookback period (e.g., 20, 50, or 200 days).
- $P_t$: The closing price at the current period $t$.
- $P_{t-i}$: The closing price $i$ periods prior to the current bar.
The Rolling Calculation and the “Drop-Off Effect”
Trading software optimizes SMA computation dynamically:
$$\text{SMA}t = \text{SMA}{t-1} + \frac{P_t - P_{t-n}}{n}$$
This formulation illustrates a known structural quirk of the SMA called the “Drop-Off Effect” (or “Barking Dog Effect”). If a massive outlier price spike occurred exactly $n$ periods ago, the SMA will drop abruptly today when that old data point falls out of the averaging window, even if current market prices are completely motionless.
SMA vs. Exponential Moving Average (EMA) vs. Weighted Moving Average (WMA)
| Moving Average Type | Weighting Methodology | Responsiveness to New Prices | Lag Factor | Institutional Usage |
|---|---|---|---|---|
| Simple (SMA) | Equal (100% unweighted across all periods) | Moderate; changes gradually | Highest | Long-term macro trend filters (50, 100, 200 Daily SMA) |
| Exponential (EMA) | Exponentially skewed toward recent data | Fast; reacts rapidly to recent volatility | Lowest | Short-term momentum trading, MACD construction (9, 21 EMA) |
| Weighted (WMA) | Linearly descending weights from newest to oldest | High; emphasizes recent data | Moderate | Specialized algorithmic quantitative trend models |
Institutional Benchmark Timeframes
In global financial markets, four specific SMA lookback periods command massive institutional respect:
                    INSTITUTIONAL SMA HIERARCHY (DAILY CHART)

   [ 20-Day SMA ]   ──► Short-Term Momentum: "Fast" trend guide; often used as
                        the central baseline for 20,2 Bollinger Bands.
   [ 50-Day SMA ]   ──► Intermediate Trend: Benchmark for quarterly rebalancing;
                        widely followed by institutional asset managers.
   [ 100-Day SMA ]  ──► Medium-Term Structural Pivot: Major support/resistance
                        in multi-month currency trends.
   [ 200-Day SMA ]  ──► The Long-Term Line in the Sand: Divides secular bull markets
                        from secular bear markets; mandated in institutional fund risk rules.
Classical Trading Strategies Using the SMA
Professional technical analysts deploy the Simple Moving Average within defined systematic frameworks:
1. The Golden Cross and Death Cross
- The Golden Cross: Occurs when the short-term 50-day SMA crosses decisively above the long-term 200-day SMA. It signals that medium-term bullish momentum is overpowering long-term stagnation, often marking the inception of multi-year secular bull markets.
- The Death Cross: Occurs when the 50-day SMA crosses below the 200-day SMA, indicating that recent pricing momentum has deteriorated and warning of an impending cyclical bear market.
                  THE GOLDEN CROSS TECHNICAL FORMATION

 Price / SMA
   │                                                 / (Bull Market Advance)
   │                                   50-Day SMA  /
   │                                       \      /
   │                                        \    /
   │                     200-Day SMA         \  /
   │  ────────────────────────────────────────><──────────────────────────────
   │                                         /  \
   │                                        /    \
   │                                       /   [ GOLDEN CROSS POINT ]
   └────────────────────────────────────────────────────────────────────────► Time
2. Dynamic Support and Resistance
During mature trending markets, moving averages function as flexible, dynamic boundaries. In a strong uptrend, institutional buyers routinely place limit bids near the 20-day or 50-day SMA, treating pullbacks to the moving average as high-probability value entry zones.
Real-World Institutional Case Study: The 200-Day SMA in the 2022 S&P 500 Bear Market
Throughout the aggressive Federal Reserve monetary tightening cycle of 2022, the 200-day SMA on the S&P 500 (SPX) served as an impenetrable institutional ceiling:
       S&P 500 RESPECTING THE 200-DAY SMA (2022)

 4,800 ──┐ (All-Time High - Jan 2022)
         │\
 4,600 ──┼─\__ [ S&P breaks BELOW 200-Day SMA: Bear Market Confirmed ]
         │    \
 4,300 ──┼─────\────* [ Test 1: Rejected at 200 SMA in March 2022 ]
         │      \  /
 4,100 ──┼───────\/───* [ Test 2: Rejected at 200 SMA in August 2022 ]
         │            \
 3,600 ──┼─────────────\___ Bear Market Low (October 2022)
└──────────────────────────────────────────────────────────────- Institutional Mandates: Major sovereign wealth funds, pension endowments, and algorithmic risk-parity funds possess strict internal compliance rules: if broad market equities trade below their 200-day SMA, equity allocations are systematically capped, and leverage is eliminated.
- The Rejections: In March 2022 and again in August 2022, sharp bear-market counter-trend rallies drove the S&P 500 directly into its declining 200-day SMA. On both occasions, institutional sell programs immediately activated, triggering massive selloffs that drove the index down to new cycle lows.
- The Bullish Reclaim: It was not until January 2023, when the index closed decisively above the 200-day SMA and held the retest, that institutional desks flipped their risk models back to aggressive accumulation.
Frequently Asked Questions
Why do institutional funds prefer the 200-day SMA over the 200-day EMA?
While the EMA is mathematically superior for short-term active trading due to reduced lag, the 200-day SMA has been the standard institutional benchmark for nearly a century. Because trillions of dollars in mutual funds, central banks, and quantitative algorithms explicitly monitor the 200-day SMA, it becomes a powerful self-fulfilling prophecy in global financial markets.
What is the biggest limitation of trading with a Simple Moving Average?
The SMA’s greatest weakness is its performance in sideways, range-bound markets. When an asset consolidates without a clear directional trend, the moving average flattens out through the middle of the price action, generating continuous false crossover signals (“whipsaws”) that lead to repeated stop-out losses.
How do traders choose the ideal SMA period for their trading style?
- Scalpers and Day Traders: 9, 20, and 50 periods on 1-minute, 5-minute, or 15-minute charts.
- Swing Traders: 20, 50, and 100 periods on 4-hour and daily charts.
- Position and Macro Traders: 50, 100, and 200 periods on daily and weekly charts.
Ready to trade forex?
Open a free demo account with a regulated broker. Practice with virtual funds before risking real money.