Golden Cross
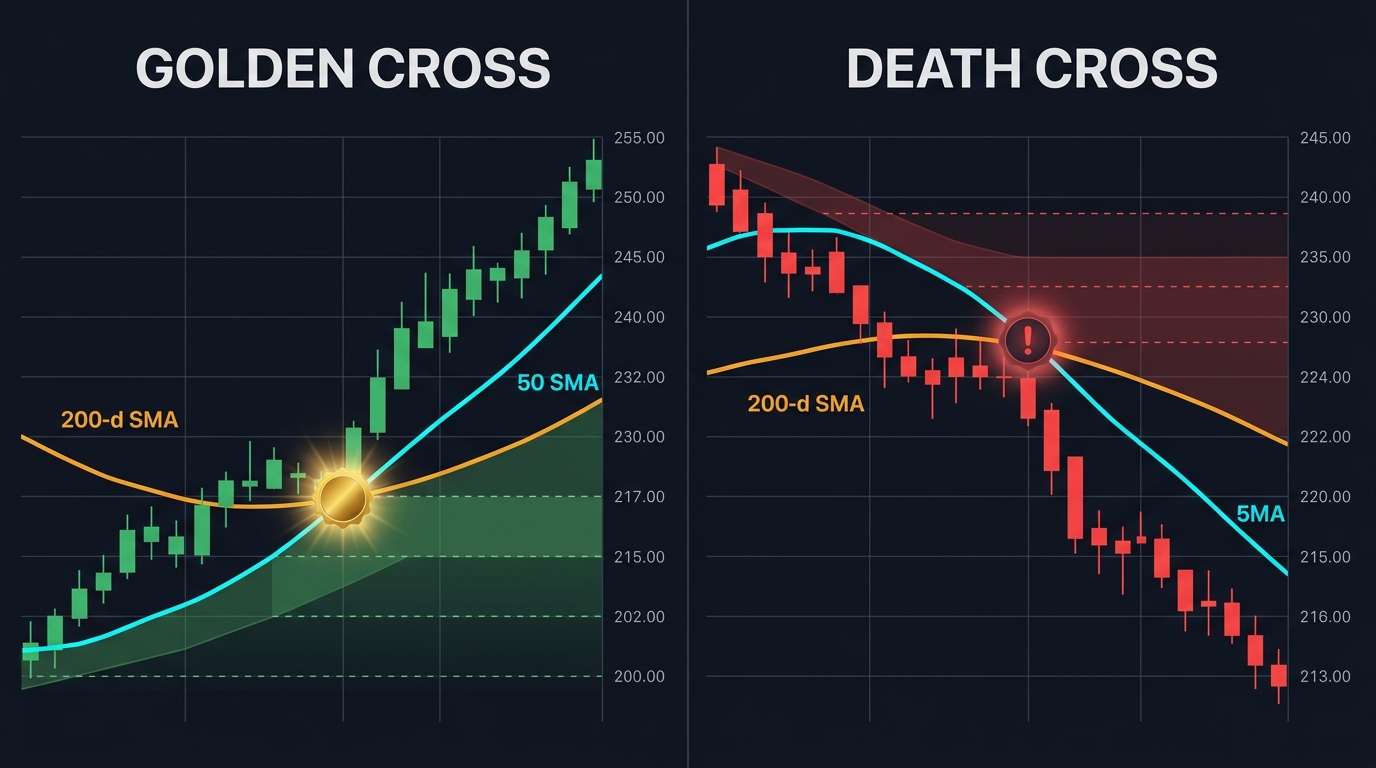
A golden cross is a bullish technical chart pattern occurring when a short-term moving average (typically the 50-day SMA) crosses above a long-term moving average (typically the 200-day SMA), signaling the potential inception of a long-term bull market.
What Is a Golden Cross?
A golden cross is one of the most widely recognized bullish chart patterns in technical analysis. It occurs when a shorter-term moving average—most commonly the 50-day Simple Moving Average (SMA)—crosses decisively above a longer-term moving average, universally represented by the 200-day SMA.
The formation is interpreted across institutional trading desks, quantitative funds, and retail communities as a structural shift in market momentum. It indicates that recent buyers are paying higher average prices than long-term holders, signifying that buying pressure is overpowering historical resistance and establishing a favorable environment for a sustained primary uptrend.
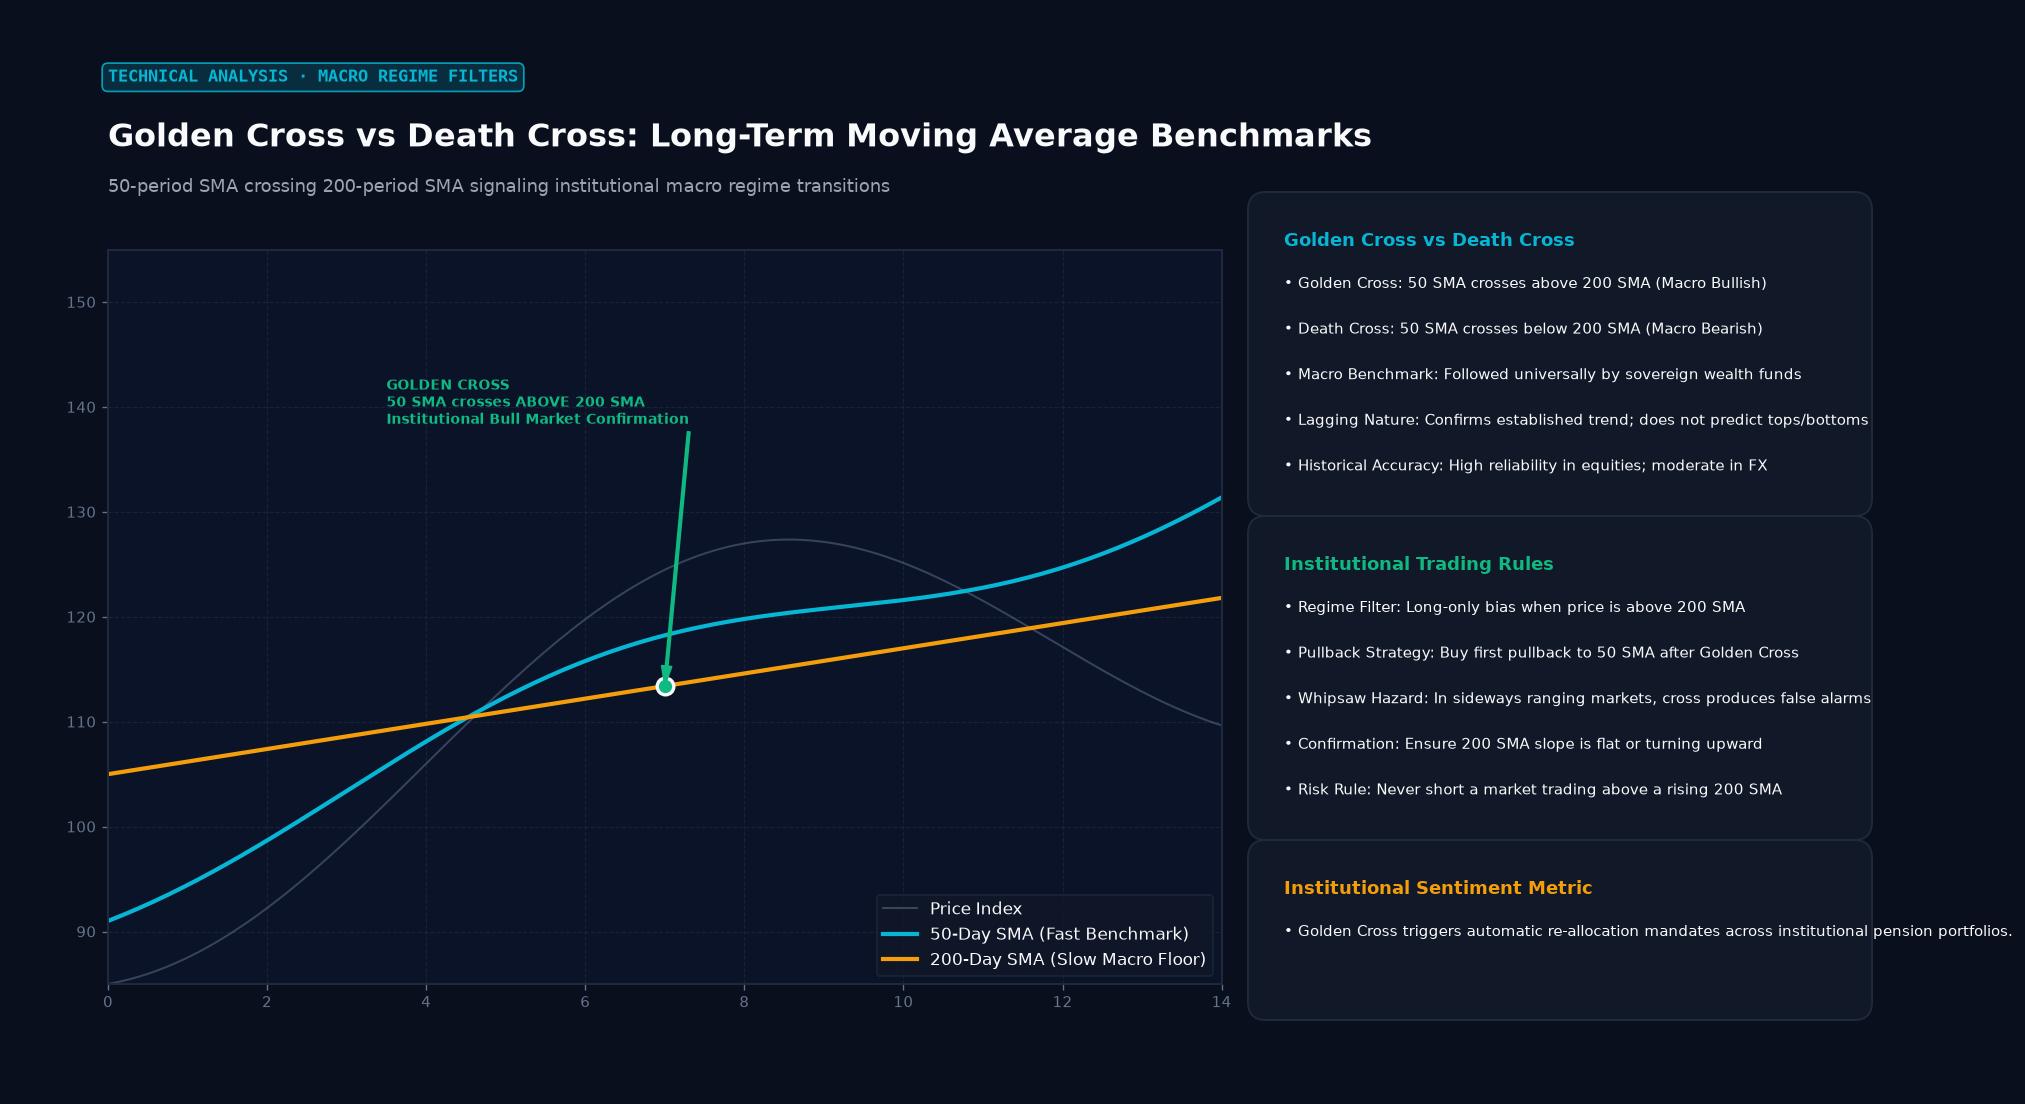 Figure: 50-period SMA crossing 200-period SMA signaling institutional macro regime transitions
The Three Structural Phases of a Golden Cross
A golden cross does not materialize overnight. It unfolds through three distinct structural phases:
Phase 1: The Downtrend Exhaustion
Before a golden cross can occur, the market must endure a prolonged downtrend or consolidation during which the 50-day SMA trades well below the 200-day SMA. Over weeks or months, aggressive selling pressure wanes, base-building accumulation takes place, and price action begins printing higher swing lows. The downward trajectory of the 50-day SMA flattens and curves upward.
Phase 2: The Crossover Event
As fresh capital enters the asset, short-term momentum accelerates. The 50-day SMA ascends rapidly and crosses above the 200-day SMA. In equities and exchange-traded futures, this crossover is typically accompanied by a measurable spike in trading volume, confirming institutional accumulation. In spot forex, momentum oscillators like the Relative Strength Index (RSI) and MACD show sustained bullish readings above their neutral midpoints.
Phase 3: The Trend Continuation and Support Test
Following the crossover, the 200-day SMA and 50-day SMA diverge upward. Rather than chasing the market immediately upon the crossover, disciplined traders observe subsequent pullbacks. In a healthy bull market, the 50-day and 200-day SMAs transition from overhead resistance into durable dynamic support zones.
Golden Cross vs. Death Cross
The inverse of the golden cross is the death cross, which signals an impending bear market:
| Feature | Golden Cross | Death Cross |
|---|---|---|
| Moving Average Action | 50 SMA crosses above 200 SMA | 50 SMA crosses below 200 SMA |
| Market Sentiment | Bullish; risk-on expansion | Bearish; risk-off capital preservation |
| Institutional Response | Accumulation; trend-following buy programs | Liquidation, hedging, and short positioning |
| Volume Characteristic | Expands on upward breakout swings | Spikes on heavy liquidation bars |
| Dynamic Role of SMAs | Act as rising support levels on retracements | Act as descending resistance ceilings on rallies |
The Lagging Indicator Dilemma: Managing Whipsaw Risk
The primary vulnerability of the golden cross is that both moving averages are lagging indicators derived from historical closing prices. By the time a 50-day SMA crosses a 200-day SMA, the market has often already rallied 5% to 15% off its cyclical bottom.
In choppy or range-bound markets, relying blindly on golden crosses produces severe whipsaws:
False Breakout (Whipsaw) in Range-Bound Market
------------------------------------------------------------------------
Price Action:   Rallies sharply inside range -> 50 SMA crosses 200 SMA
Trader Action:  Buys market order on the crossover
Outcome:        Price hits range resistance, reverses sharply, and triggers
                stop losses while the moving averages re-cross downward.
Best Practices for Trading the Golden Cross in Forex
- Never Buy Market Orders on the Crossover Day: Because the market is frequently overbought when the crossover prints, wait for a secondary retracement back toward the 50-day SMA or prior breakout structure.
- Seek Multi-Indicator Confirmation: Ensure that the 200-day SMA has at least flattened or started sloping upward. A golden cross occurring while the 200-day SMA is still sloping steeply downward carries a substantially higher failure rate.
- Incorporate Higher-Timeframe Context: Verify that the currency pair’s weekly chart is not colliding with major macro resistance levels.
Real-World Forex Example: USD/JPY Multi-Month Trend
A textbook example of the golden cross occurred on the daily chart of USD/JPY in early 2021. Following a multi-year consolidation between 104.00 and 108.00, accelerating US Treasury yields drove spot prices higher.
In April 2021, the 50-day SMA crossed decisively above the 200-day SMA around 108.50. Over the subsequent weeks, price retraced to test the rising 50-day SMA as dynamic support near 109.00 before embarking on a historic multi-year macroeconomic rally that eventually carried USD/JPY past 150.00.
Key Takeaways
- A golden cross is a long-term bullish signal triggered when the 50-day SMA crosses above the 200-day SMA.
- The formation reflects a shift where short-term momentum decisively overpowers long-term downward drag.
- Because moving averages lag price action, the crossover confirms an established trend rather than predicting an immediate bottom.
- Golden crosses produce reliable signals in trending macro markets, but generate false breakout whipsaws during horizontal ranges.
- Professional traders avoid buying the crossover bar directly, waiting instead for pullbacks to test the moving averages as dynamic support.
Frequently Asked Questions
Can a golden cross be applied to intraday timeframes like 1-hour or 15-minute charts?
Yes, traders apply 50 and 200 moving average crossovers on 1-hour or 4-hour charts for intraday trend filtering. However, intraday signals generate significantly more false positives and noise than the classical daily chart golden cross.
Should I use Simple Moving Averages (SMA) or Exponential Moving Averages (EMA)?
Traditional institutional desks universally track the Simple Moving Average (50 SMA and 200 SMA) because it weights all days equally and smooths out short-term spikes. EMA crossovers (such as 20 EMA crossing 50 EMA) respond faster but are not considered classical golden crosses.
What should a trader do if a golden cross fails?
If price breaks decisively back below both the 50-day and 200-day SMAs shortly after the crossover, the signal is invalidated. Traders must enforce strict stop-loss rules below the preceding swing low to limit capital loss.
Ready to trade forex?
Open a free demo account with a regulated broker. Practice with virtual funds before risking real money.