Technical Indicators
Technical indicators are mathematical formulas applied to historical price, trading volume, and open interest data to identify market trends, evaluate momentum, measure volatility, and forecast potential price turning points.
Technical indicators are quantitative tools used by currency traders and institutional quantitative analysts to interpret raw market data. By running closing prices, highs, lows, and volume through mathematical algorithms, indicators filter out random market noise, revealing structural patterns, momentum shifts, and statistical extremes.
Rather than predicting the future with certainty, technical indicators provide objective probabilistic frameworks. They help traders determine whether an exchange rate is trending or consolidating, whether an asset is overextended, and where to position defensive stop-loss and take-profit targets.
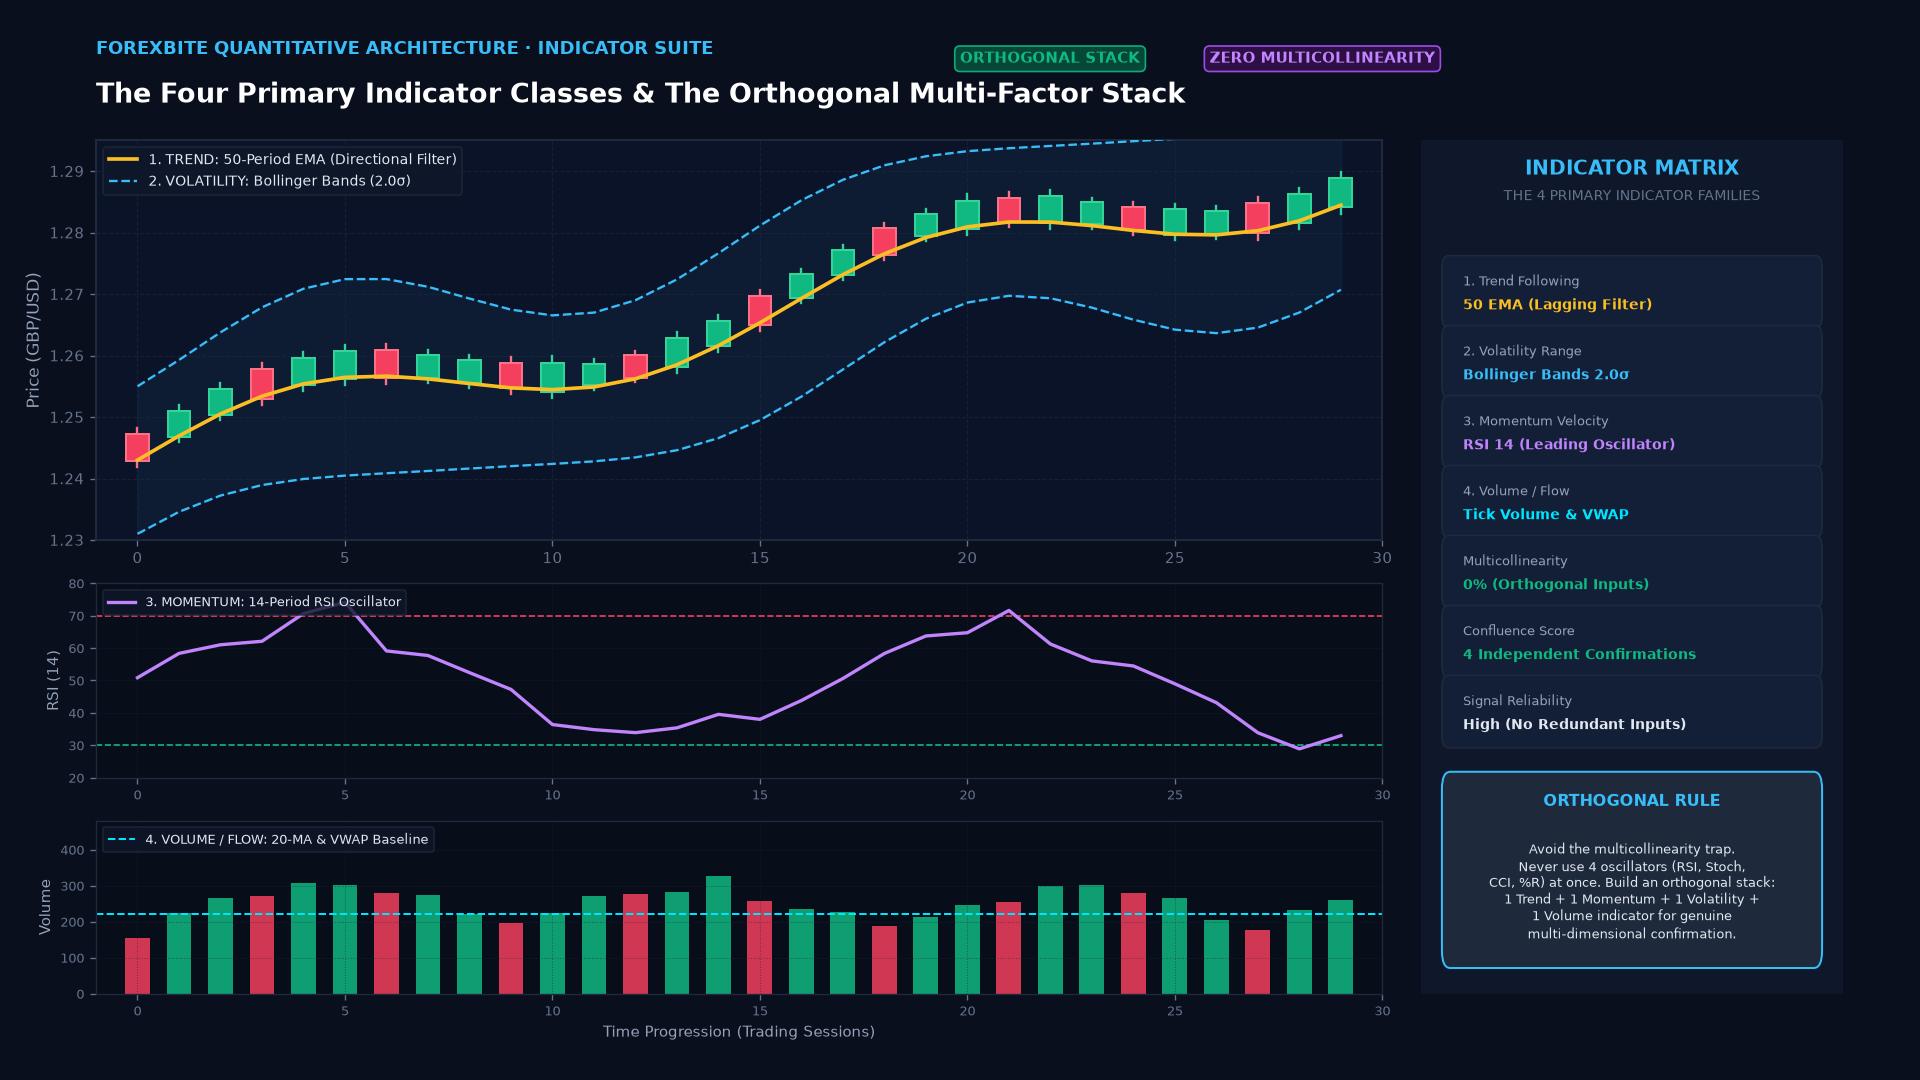
The Four Primary Classes of Technical Indicators
Technical tools are categorized into four functional families based on the market dynamics they measure:
| Indicator Category | Primary Market Function | Leading Popular Examples | Best Market Regime |
|---|---|---|---|
| Trend-Following | Identifies directional trajectory and trend persistence | Simple Moving Average (SMA), Exponential Moving Average (EMA), Parabolic SAR, ADX | Strong directional trends; sustained breakouts |
| Momentum / Oscillators | Gauges price velocity, overbought/oversold levels, and exhaustion | Relative Strength Index (RSI), Stochastic Oscillator, MACD, Rate of Change (ROC) | Cycle turns, mean-reversion, range boundaries |
| Volatility | Quantifies the dispersion and range of price swings | Average True Range (ATR), Bollinger Bands, Keltner Channels, Standard Deviation | Breakout anticipation, stop-loss sizing |
| Volume / Flow | Assesses institutional trading activity and conviction | Tick Volume, On-Balance Volume (OBV), Volume Weighted Average Price (VWAP) | Liquidity confirmation, false breakout detection |
Leading vs. Lagging Indicators
A foundational concept in technical analysis is the trade-off between speed and reliability:
1. Lagging Indicators (Trend-Following)
Lagging indicators—such as moving averages and Bollinger Bands—follow price action. Because they calculate averages of past periods, they change direction only after the underlying market has already reversed:
- Advantage: Low rate of false signals; keeps traders aligned with major multi-month secular trends.
- Disadvantage: Delayed entry; traders miss the initial portion of a reversal and give back profit during exits.
2. Leading Indicators (Oscillators)
Leading indicators—such as the RSI, Stochastic, and MACD Histogram—attempt to anticipate price reversals before they occur by measuring changes in acceleration:
- Advantage: Allows traders to enter near market tops or bottoms with tight risk-reward parameters.
- Disadvantage: Prone to frequent whipsaws and false alarms during strong trending regimes.
The Multicollinearity Trap: Avoiding Indicator Redundancy
A common mistake among novice retail traders is cluttering their charts with five or six different indicators. When an analyst plots the RSI, Stochastic Oscillator, Commodity Channel Index (CCI), and Williams %R simultaneously, all four lines usually point in the exact same direction.
This creates an illusion of high-conviction confirmation known statistically as multicollinearity. Because all four oscillators are mathematical derivatives of closing price relative to recent high-low ranges, they measure the exact same data.
The Professional “Orthogonal” Indicator Stack
To avoid redundancy, institutional trading desks build multi-dimensional systems combining non-correlated inputs:
- One Trend Filter: 50-period or 200-period EMA to establish macro directional bias.
- One Momentum Tool: RSI or MACD to assess entry timing and divergence.
- One Volatility Gauge: ATR to calculate dynamic stop-loss placement based on actual market noise.
- Pure Market Structure: Horizontal support and resistance levels established directly on candlestick charts.
Practical Example: A Multi-Indicator Confluence Setup on GBP/USD
Consider a swing trader scanning GBP/USD on a 4-hour chart:
- Trend Direction (EMA): GBP/USD trades comfortably above its rising 50-period EMA (1.2950), confirming an intact bullish trend.
- The Retracement: The currency pair pulls back from 1.3080 to test a key horizontal support level at 1.2980.
- Momentum Confirmation (RSI): As price touches 1.2980, the 14-period RSI drops into oversold territory at 28 and prints a bullish divergence against price action.
- Volatility Sizing (ATR): The 14-period ATR reads 40 pips. The trader uses $1.5 \times \text{ATR}$ (60 pips) to set a defensive stop-loss at 1.2920, ensuring standard market noise does not prematurely stop out the trade.
- Trade Execution: The trader enters long at 1.2985, targeting the previous swing high at 1.3105 (targeting 120 pips against a 65-pip stop, delivering nearly 2:1 reward-to-risk).
- Outcome: Confluence across trend, momentum, and volatility holds, and GBP/USD resumes its upward trajectory.
Key Takeaways
- Mathematical Frameworks: Technical indicators translate historical price and volume data into visual tools to assess market health and probability.
- Four Core Families: Comprehensive technical analysis relies on balanced inputs from trend, momentum, volatility, and volume indicators.
- Lagging vs. Leading: Lagging indicators confirm established trends, while leading oscillators measure velocity and exhaustion.
- Avoid Redundancy: Stacking multiple indicators of the same type causes multicollinearity; combine distinct, non-overlapping tools instead.
- Context is King: Indicators should never be traded in isolation; they serve as confirmation filters for underlying price action and support/resistance structure.
Frequently Asked Questions
Which technical indicator is the most accurate for forex trading?
No single indicator is universally “the best.” Moving averages (such as the 50 and 200 EMA) excel in strongly trending markets, while oscillators like the RSI and Stochastic perform best in sideways, range-bound environments. The most effective strategy combines complementary indicators tailored to the current market regime.
Why do indicators generate false signals during major economic news?
Indicators rely on past price history. High-impact fundamental news (such as central bank rate decisions or Non-Farm Payrolls) introduces fresh macroeconomic catalysts that instantly invalidate historical patterns, causing prices to blast through indicator levels without hesitation.
How many indicators should a trader use on a single chart?
Most professional traders recommend using no more than two or three complementary indicators (for example, one moving average, one momentum oscillator, and ATR for stop sizing). Keeping charts uncluttered prevents analysis paralysis and allows focus on price action.
Ready to trade forex?
Open a free demo account with a regulated broker. Practice with virtual funds before risking real money.