Technical Correction
A temporary, counter-trend price retracement within an ongoing primary market trend, triggered by technical factors such as overextended momentum, key chart resistance, or systematic profit-taking rather than a change in underlying macroeconomic fundamentals.
What Is a Technical Correction?
A technical correction describes a short-to-medium-term price retracement against the prevailing primary trend that is driven primarily by internal market mechanics, technical indicators, and liquidity rebalancing rather than a material shift in fundamental economic data.
In financial markets, prices rarely advance or decline in an unbroken straight line. As an asset trends strongly in one direction, technical oscillators become overbought or oversold, speculative momentum exhausts itself, and profitable market participants execute automated profit-taking orders. The resulting counter-trend move allows the market to digest prior gains, wash out weak leveraged positions, and test critical support or resistance levels before the broader secular trend reasserts itself.
In equity markets, a technical correction is colloquially defined as a 10% to 15% decline from recent peak highs. In foreign exchange and commodity markets, technical corrections are standardly quantified through Fibonacci retracement ratios (typically 38.2%, 50.0%, or 61.8% of the preceding swing).
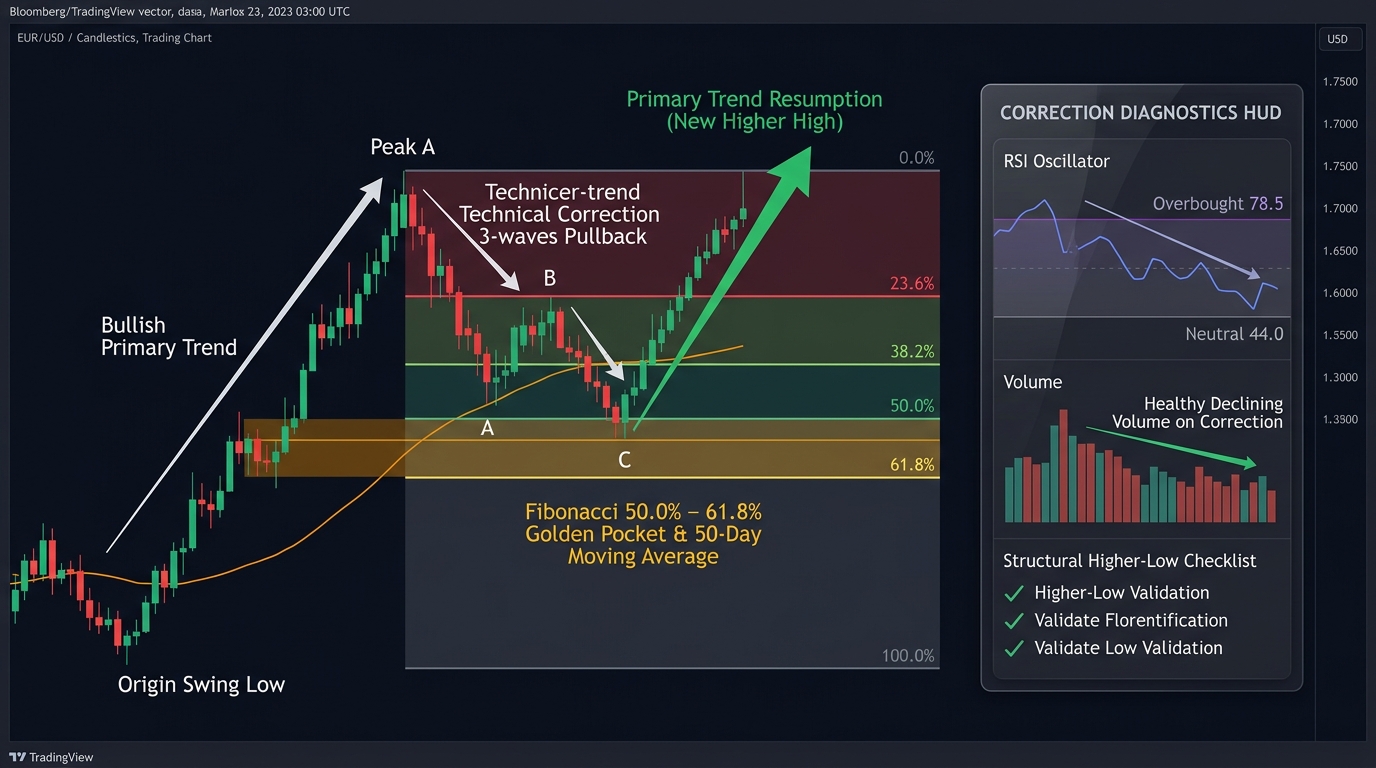
Technical Correction vs. Macro Reversal vs. Bear Market
To avoid premature panic or holding losing positions through a catastrophic trend change, traders rigorously distinguish between corrections and true reversals:
| Dimension | Technical Correction | Trend Reversal | Bear Market |
|---|---|---|---|
| Price Magnitude | 5% to 15% (or 38.2%–61.8% Fibonacci retracement) | Breaks prior structural swing low/high | Decline exceeding 20% from all-time highs |
| Underlying Catalyst | Technical exhaustion, profit taking, overbought RSI | Fundamental shift in central bank policy or earnings cycle | Prolonged economic recession, systemic credit contraction |
| Duration | Days to a few weeks | Multi-month structural shift | 9 months to multiple years |
| Market Structure | Higher lows remain structurally intact | Series of lower highs and lower lows confirmed | Prolonged, broad-based asset devaluation |
| Institutional Play | “Buy the Dip” in the direction of the primary trend | Liquidate longs; initiate short hedges | Capital preservation; defensive cash and treasuries |
The Technical Triggers of a Correction
A technical correction is typically precipitated by the convergence of three quantitative chart conditions:
- Oscillator Divergence (RSI & MACD): When price prints a higher high, but the Relative Strength Index (RSI) or MACD prints a lower high (bearish divergence), it confirms that buying velocity is decelerating, signaling an imminent corrective pullback.
- Mean Reversion to Moving Averages: When an asset moves too far and too fast away from its 20-day, 50-day, or 200-day moving average, the “rubber band” effect triggers systematic mean-reversion programs to drag prices back toward the statistical mean.
- Liquidity Sweeps of Round Numbers: Approaching major psychological barriers (e.g., Gold $2,500 or USD/JPY 160.00) activates pre-set institutional take-profit limit orders, creating an immediate supply wall that sparks a correction.
Mathematical Measurement: Fibonacci Retracement Levels
Technical analysts measure the depth of a correction using the mathematical proportions derived from the Fibonacci sequence:
$$\text{Retracement Level} = \text{Peak Price} - \left[ (\text{Peak Price} - \text{Trough Price}) \times \text{Ratio} \right]$$
                   FIBONACCI CORRECTION MATRIX

  Peak Price: 1.1000 ──┐
                       ├─► 23.6% Retracement: 1.0882 (Shallow; flags runaway momentum)
                       ├─► 38.2% Retracement: 1.0809 (Standard healthy correction)
                       ├─► 50.0% Retracement: 1.0750 (Dow Theory equilibrium zone)
                       ├─► 61.8% Retracement: 1.0691 ("Golden Ratio" maximum buffer)
  Trough:     1.0500 ──┘
                       └─► Breakdown below 61.8% warns of STRUCTURAL REVERSAL
If a market pulls back and finds aggressive institutional buying between the 38.2% and 61.8% levels, the move is confirmed as a textbook technical correction. A breakdown beyond the 78.6% level invalidates the correction thesis and signals an outright trend reversal.
Real-World Institutional Case Study: EUR/USD Counter-Trend Corrections in the 2022 Bear Trend
Throughout 2022, the U.S. Federal Reserve enacted an ultra-aggressive interest rate hiking cycle, driving the U.S. Dollar into a historic bull market and forcing EUR/USD into a brutal secular downtrend:
       EUR/USD SECULAR DOWNTREND & TECHNICAL CORRECTIONS (2022)

 1.1400 ──┐ (Feb 2022)
          │\
 1.0800 ──┼─\___  Drop 1 (Fundamental Driver: Fed Hikes)
          │     \
 1.1100 ──┼──────* [ TECHNICAL CORRECTION 1: Rallies 300 pips to 50 SMA ]
          │       \  Institutional Desks "Sell the Rip"; Downtrend Resumes
 1.0350 ──┼────────\___ Drop 2
          │            \
 1.0600 ──┼─────────────* [ TECHNICAL CORRECTION 2: Short-squeeze bounce ]
          │              \
0.9535 ──┴───────────────\___ Cycle Trough: September 2022 (Below Parity)- The Macro Backdrop: High U.S. inflation and Russian gas cutoffs to Europe provided overwhelming fundamental justification for a weaker Euro.
- The Technical Corrections: Despite the powerful downtrend, EUR/USD staged three distinct multi-week technical corrections of 250 to 400 pips. On each occasion, oversold technical readings and short-covering triggered a counter-trend bounce directly into the declining 50-day moving average.
- The Institutional Playbook: Sophisticated macro hedge funds did not interpret these bounces as trend reversals. Instead, they treated each technical correction as an optimal institutional liquidity window to initiate fresh short positions at premium prices.
Tactical Rules: How Traders Exploit Technical Corrections
- Never Counter-Trend Scalp without Strict Risk Limits: Attempting to trade the correction itself (buying a falling knife in a downtrend) carries poor mathematical expectancy. The high-probability trade is waiting for the correction to exhaust itself and re-entering in the direction of the primary trend.
- Look for Confluence Zones: The most dependable entry signals occur when a Fibonacci retracement level aligns with a major prior horizontal support/resistance shelf and a dynamic moving average (e.g., 50 EMA).
- Wait for Reversal Candlestick Confirmation: Do not place blind limit orders in a falling market. Wait for the correction to print a bullish pin bar, engulfing candle, or hammer on the 4-hour chart before committing capital.
Frequently Asked Questions
Why are technical corrections considered healthy for a financial market?
Uninterrupted vertical price advances create dangerous speculative bubbles where asset prices detach completely from fundamental value, making the market vulnerable to catastrophic flash crashes. A technical correction shakes out weak leveraged speculative traders, allows long-term institutional buyers to accumulate at fair value, and builds structural support floors necessary to sustain long-term secular bull markets.
What is the average duration of a technical correction?
On daily and weekly timeframes, a standard technical correction typically lasts between one and six weeks. On intraday charts (such as 15-minute or 1-hour timeframes), technical corrections frequently resolve within a few hours to several trading sessions.
Can a technical correction evolve into a full-scale bear market?
Yes. If an unexpected macroeconomic shock hits the market during an ongoing technical correction (such as an unexpected recession indicator or systemic banking failure), the pullback can accelerate beyond technical support levels, transforming a routine 10% correction into a devastating 25%+ bear market.
Ready to trade forex?
Open a free demo account with a regulated broker. Practice with virtual funds before risking real money.