TED Spread
A premier indicator of perceived credit risk and systemic stress in the global financial system, calculated as the mathematical difference between the 3-month interbank lending rate and the 3-month risk-free U.S. Treasury bill yield.
What Is the TED Spread?
The TED spread is one of the most widely monitored macroeconomic indicators of systemic credit risk and counterparty confidence in the international banking system.
The acronym “TED” originates from the historical pairing of two financial instruments:
- T: T-Bills (U.S. Treasury Bills, the universal risk-free sovereign debt benchmark).
- ED: Eurodollars (the ticker symbol for the 3-month London Interbank Offered Rate (LIBOR) futures contract traded on the Chicago Mercantile Exchange).
The TED spread measures the premium that commercial banks demand to lend unsecured funds to one another in the private interbank market compared to the yield on risk-free debt backed by the full faith and credit of the United States government.
When international banks trust one another’s solvency, the TED spread compresses to historic lows. When banks fear that peer institutions carry toxic assets or face imminent insolvency, interbank lending rates surge while capital flees into the safety of short-term government debt, blowing the TED spread wide open.
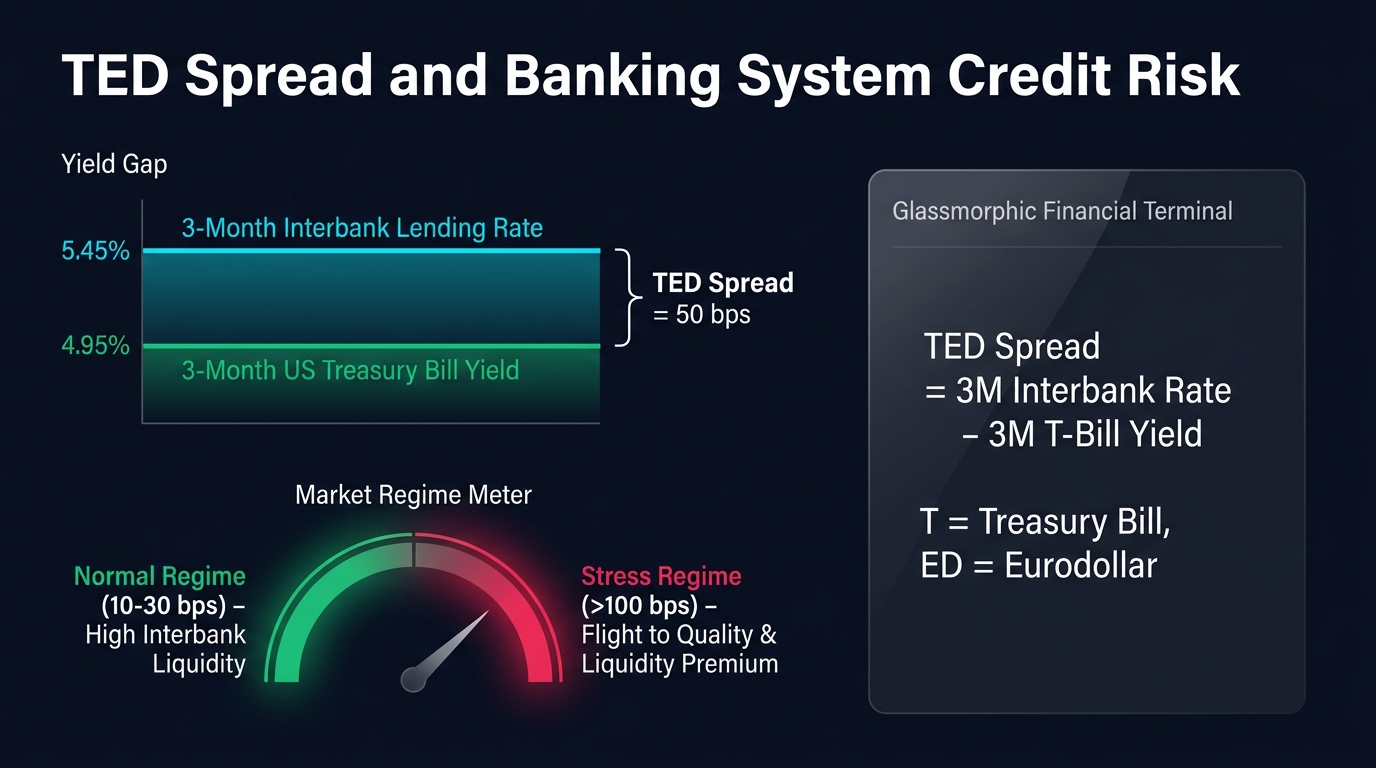
                      THE TED SPREAD SYSTEMIC TRANSMISSION

  3-Month Commercial Interbank Rate        3-Month Risk-Free U.S. Treasury Bill
  (LIBOR / Term SOFR: Carries Bank Risk)   (Backed by U.S. Government Sovereign Credit)
               │                                            │
               └─────────────────────┬──────────────────────┘
                                     │
                                     ▼
                    [ TED SPREAD = INTERBANK - T-BILL ]
                                     │
        ┌────────────────────────────┴────────────────────────────┐
        ▼                                                         ▼
  CALM REGIME (10 – 30 bps)                               CRISIS REGIME (> 100 – 400+ bps)
  - Interbank credit flows freely                         - Banks hoard liquidity; refuse lending
  - High counterparty confidence                          - Flight to safety drives T-bill yields down
  - Liquid, stable market conditions                      - Extreme systemic banking panic
The Mathematical Formula and Interpretation
The TED spread is calculated by subtracting the 3-month risk-free U.S. Treasury yield from the 3-month interbank benchmark rate:
$$\text{TED Spread} = \text{3-Month Interbank Lending Rate} - \text{3-Month U.S. Treasury Bill Yield}$$
The spread is standardly quoted in basis points (bps), where $1\text{ bps} = 0.01%$:
$$\text{Spread in bps} = (\text{Interbank Rate} - \text{T-Bill Yield}) \times 100$$
Numerical Example
- 3-Month Interbank Rate (LIBOR / Term SOFR): 5.45%
- 3-Month U.S. Treasury Bill Yield: 5.15%
- $\text{TED Spread} = 5.45% - 5.15% = 0.30% = \mathbf{30 \text{ basis points}}$.
Historical Benchmark Zones and Market Regimes
Macro hedge funds and central bank risk officers evaluate the TED spread across distinct historical stress tiers:
| TED Spread Range | Financial System State | Interbank Credit Conditions | Typical Market Behavior |
|---|---|---|---|
| 10 – 30 bps | Normal / Benign | Plentiful liquidity; banks lend freely | Bullish equities, tight corporate credit spreads, stable FX carry trades |
| 50 – 100 bps | Elevated Stress | Tightening credit; selective counterparty tiering | Volatility expands; equities consolidate; emerging market capital outflows |
| 100 – 200 bps | Acute Liquidity Squeeze | Severe counterparty distrust; money markets seize | Flight to cash; aggressive liquidation across high-beta assets |
| > 300 bps | Systemic Catastrophe | Interbank lending market completely paralyzed | Global stock market crashes; sovereign emergency central bank bailouts |
Real-World Institutional Case Study: The 2008 Lehman Brothers Meltdown
The power of the TED spread as a leading indicator of systemic collapse was illustrated during the Global Financial Crisis of 2007–2008:
       HISTORIC TED SPREAD SPIKE (2007–2008 CRISIS)

 450 bps ──┐                                         ┌─── ALL-TIME RECORD: 464 bps (Oct 2008)
           │                                         │    (Post-Lehman Complete Market Seizure)
 350 bps ──┼                                        /│
           │                                       / │
 250 bps ──┼                         _..-''`\     /  │
           │                  _.-''`         \   /   │
 150 bps ──┼─-.._      _.-''`                 '-'    │
           │     `''--' (Aug 2007: BNP Paribas)      │
  30 bps ──┼─────────────────────────────────────────┴─────────────────────
Jan 2007 Aug 2007 Mar 2008 Oct 2008- Early Warning (August 2007): In August 2007, when French bank BNP Paribas froze three investment funds exposed to U.S. subprime mortgages, the TED spread surged from its historical baseline of 30 bps to over 150 bps, warning macro desks that subprime toxicity was lodged inside the banking sector.
- The Cataclysm (September–October 2008): Following the bankruptcy of Lehman Brothers Holdings Inc. on September 15, 2008, commercial banks ceased lending to one another overnight, fearing that peer institutions were concealing billions in subprime losses.
- The Record Print: Banks desperately plowed cash into 3-month Treasuries (driving T-bill yields to near zero) while 3-month interbank rates exploded. On October 10, 2008, the TED spread spiked to an astronomical all-time peak of 464 basis points (4.64%), marking the absolute apex of the global financial panic.
The Modern Post-LIBOR Transition
Historically, the TED spread utilized the London Interbank Offered Rate (LIBOR). Following international regulatory investigations into the LIBOR manipulation scandal, global financial regulators officially retired USD LIBOR in June 2023.
In modern financial engineering, the systemic risk role historically played by the TED spread has transitioned to:
- The SOFR-Treasury Spread: Comparing the Secured Overnight Financing Rate (SOFR) or Term SOFR against equivalent Treasury bill yields.
- The FRA-OIS Spread: The spread between Forward Rate Agreements (FRAs) and the Overnight Index Swap (OIS) rate, which measures purely unsecured banking credit risk without term liquidity distortions.
Frequently Asked Questions
Why is the U.S. Treasury bill considered a “risk-free” benchmark?
Short-term U.S. Treasury bills are considered the gold standard of risk-free assets because they are backed by the taxing power and currency-printing authority of the U.S. government. A sovereign government that issues debt in its own fiat currency cannot be involuntarily forced into nominal default, whereas private commercial banks can easily fail.
What happens to the foreign exchange market when the TED spread blows out?
A widening TED spread signals acute global dollar liquidity shortages. In times of systemic panic, foreign commercial banks face massive U.S. Dollar funding deficits. Capital rapidly flees emerging markets and high-beta currencies (AUD, GBP, EUR), triggering explosive safe-haven rallies in the U.S. Dollar (USD) and Swiss Franc (CHF).
Can the TED spread turn negative?
Under standard market mechanics, no. Commercial banks carry credit risk, whereas sovereign Treasuries do not; therefore, private interbank lending rates should always trade higher than Treasury bill yields. In highly distorted market scenarios involving severe Treasury short squeezes or unusual collateral dislocations, localized technical spreads can momentarily invert, but a negative TED spread is economically unsustainable.
Ready to trade forex?
Open a free demo account with a regulated broker. Practice with virtual funds before risking real money.