Total Return
A comprehensive measure of investment performance that calculates the aggregate economic gain or loss of an asset, incorporating both capital appreciation (or depreciation) and all cash distributions—including dividends and interest payments—reinvested over time.
What Is Total Return?
Total return is the premier, all-inclusive metric utilized by institutional investors and portfolio managers to assess the true financial performance of an investment. Unlike a simple price return—which tracks solely the change in an asset’s quoted market price—total return accounts for every dollar generated by the asset, including:
- Capital Gains or Losses: The market price movement of the underlying asset ($\Delta P$).
- Cash Income Distributions: Dividends, bond coupon payments, rental income, and overnight financing interest.
- The Compounding Power of Reinvestment: The mathematical growth achieved by automatically reinvesting all cash dividends and interest distributions back into purchasing additional units of the asset.
In long-term investing, evaluating an asset solely through its headline price chart is profoundly misleading. Over multi-decade investment horizons, reinvested cash distributions and compounding interest consistently account for over 40% to 60% of the entire wealth generated by equity and bond portfolios.
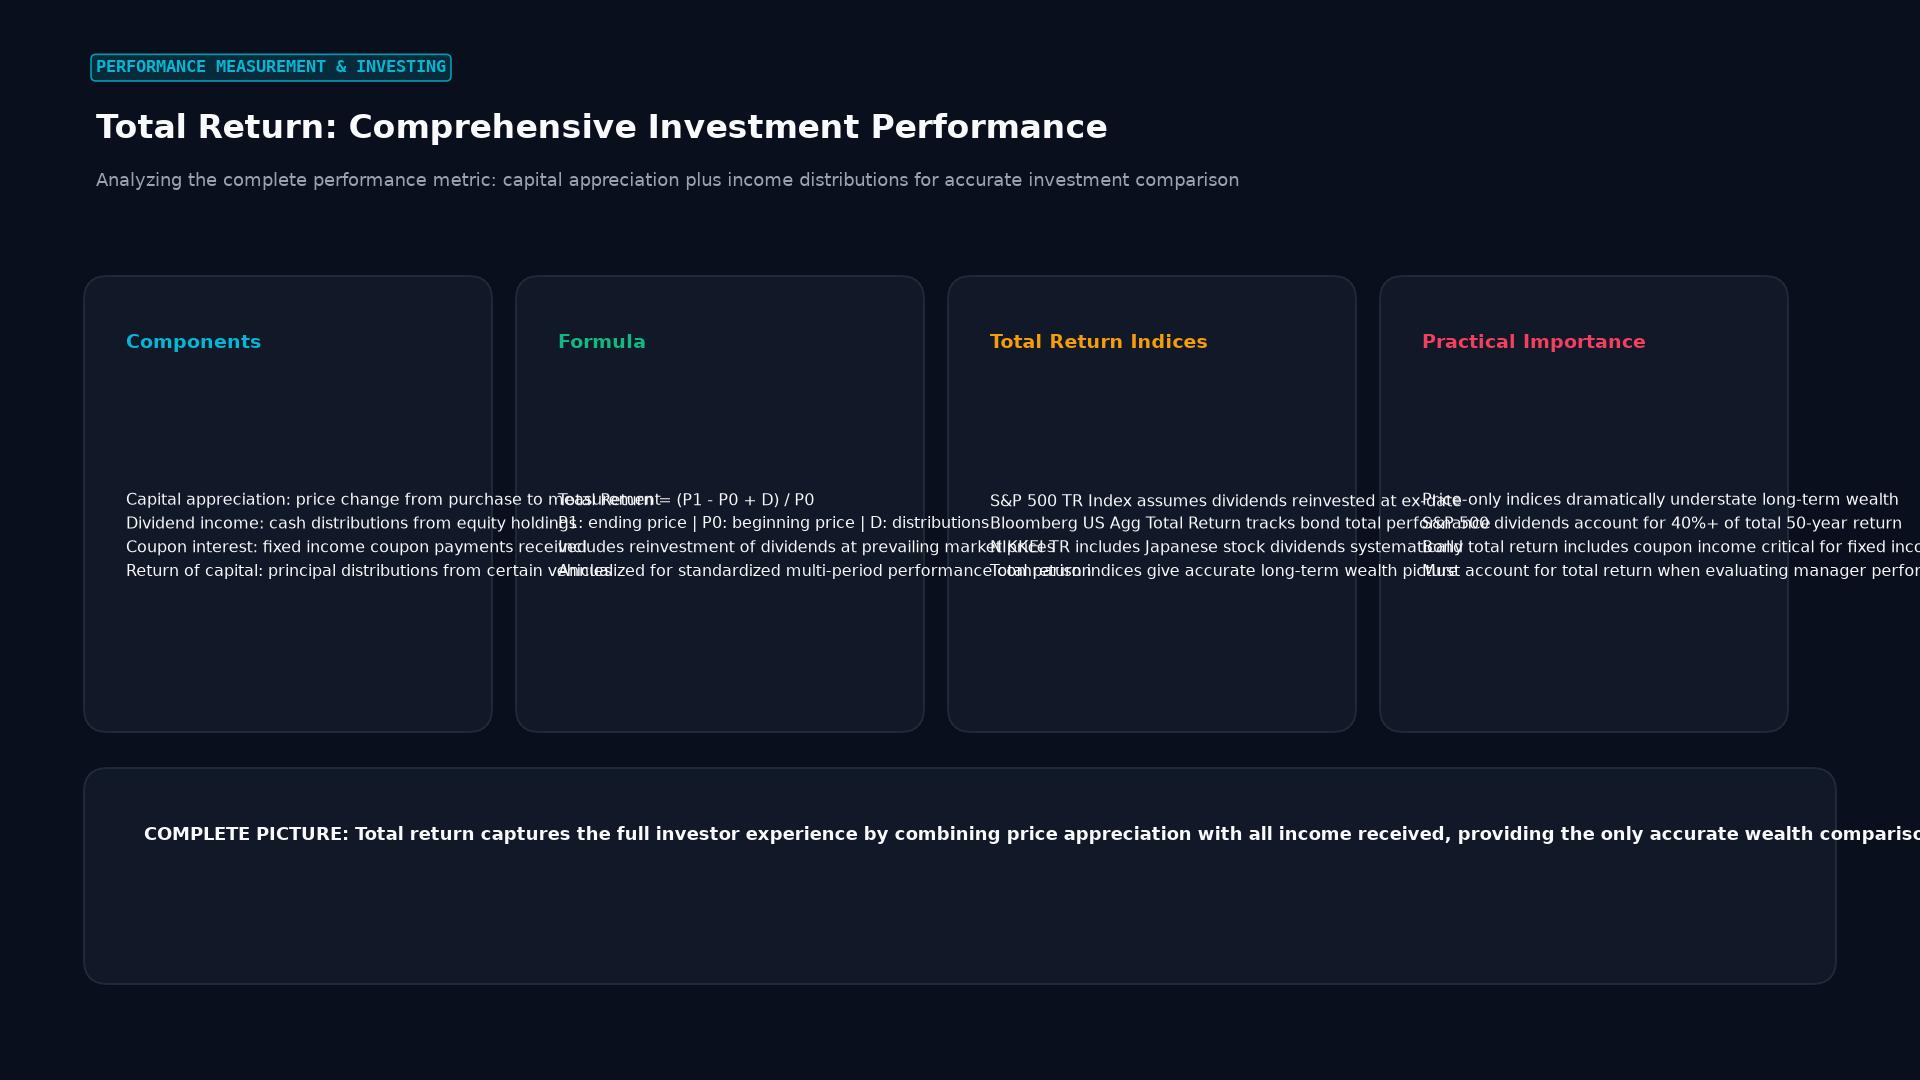 Figure: Analyzing the complete performance metric: capital appreciation plus income distributions for accurate investment comparison
The Mathematical Calculation of Total Return
The nominal total return over a single holding period is calculated as:
$$\text{Total Return (%)} = \left[ \frac{(P_{\text{end}} - P_{\text{start}}) + D + I}{P_{\text{start}}} \right] \times 100$$
Where:
- $P_{\text{start}}$: Initial purchase price of the asset.
- $P_{\text{end}}$: Ending market price or sale price.
- $D$: Cumulative cash dividends received.
- $I$: Cumulative interest or coupon payments received.
Multi-Year Compounded Annual Growth Rate (CAGR)
To compare assets held over varying multi-year durations, institutional managers convert total return into an annualized geometric figure:
$$\text{Annualized Total Return (CAGR)} = \left[ \left( \frac{\text{Final Portfolio Value}}{\text{Initial Investment}} \right)^{\frac{1}{n}} - 1 \right] \times 100$$
Where $n$ represents the total number of holding years.
Price Return vs. Total Return
Understanding the vast divergence between price-only indices and total return indices is fundamental to portfolio benchmarking:
| Metric | Capital Appreciation Included? | Cash Dividends / Interest Included? | Reinvestment Compounding? | Real-World Application |
|---|---|---|---|---|
| Price Return (Headline) | Yes | No (Completely ignored) | No | Headline media tickers (e.g., S&P 500, Dow Jones, FTSE 100) |
| Total Return (TR Index) | Yes | Yes (Captured fully) | Yes (Reinvested on ex-dividend date) | Institutional performance benchmarking, GIPS reporting, pension models |
| Net Total Return | Yes | Yes (Adjusted for foreign dividend withholding taxes) | Yes | Cross-border mutual funds and international ETFs |
Real-World Institutional Case Study: S&P 500 vs. S&P 500 Total Return Index (SPTR)
The profound impact of total return is transparently proven by comparing the standard S&P 500 Price Index against the S&P 500 Total Return Index (SPTR) over a 30-year horizon (1993–2023):
       30-YEAR PERFORMANCE DIVERGENCE: PRICE VS. TOTAL RETURN

 Portfolio Value ($)
   │
   │                                                    * [ SPTR TOTAL RETURN INDEX ]
$2,000,000┼─ ─ ─ ─ ─ ─ ─ ─ ─ ─ ─ ─ ─ ─ ─ ─ ─ ─ ─ ─ ─ ─ ─ ─/─ ─$1,980,000 (+1,880%)
   │                                                   /     (With Reinvested Dividends)
   │                                                  /
$1,000,000┼─ ─ ─ ─ ─ ─ ─ ─ ─ ─ ─ ─ ─ ─ ─ ─ ─ ─ ─ ─ ─/─ ─ ─ ─
   │                                                /
   │                                  * [ PRICE-ONLY S&P 500 ]
 $900,000┼─ ─ ─ ─ ─ ─ ─ ─ ─ ─ ─ ─ ─ ─/─ ─ ─ ─ ─ ─ ─ ─ ─ ─ ─ ─ ─$885,000 (+785%)
   │                                /                        (Excludes Dividends)
 $100,000┼─*───────────────────────'
   └────────────────────────────────────────────────────────────────► Time
1993 2008 2023- The Baseline ($100,000 Initial Investment in 1993):
- Price Return S&P 500: A $100,000 investment tracked purely on price appreciation grew to approximately $885,000 (a 785% cumulative return).
- Total Return S&P 500 (SPTR): The exact same $100,000 investment with all dividends automatically reinvested exploded to $1,980,000 (a 1,880% cumulative return).
- The Takeaway: The reinvestment of dividend income produced an additional $1,095,000 in wealth—more than doubling the terminal portfolio balance through the pure mechanics of total return compounding.
Total Return in Fixed-Income and Foreign Exchange
The total return framework applies across all asset classes, often revealing hidden performance dynamics:
1. Fixed Income (Bonds)
A bond’s total return consists of:
$$\text{Bond Total Return} = \text{Price Change (Duration Impact)} + \text{Coupon Yield} + \text{Reinvestment Yield}$$
Even if rising interest rates depress a bond’s quoted market price, high recurring coupon payments can offset price depreciation, generating a positive total return.
2. Foreign Exchange (Forex Carry Trades)
In currency speculation, holding a high-yielding currency against a low-yielding funding currency (e.g., Long USD/JPY) generates two return components:
$$\text{Forex Total Return} = \text{Spot Exchange Rate Movement} + \text{Net Cumulative Rollover/Swap Points}$$
A trader whose currency pair remains completely flat for a year can still capture an 8% to 12% total return purely through the accumulation of daily overnight rollover credits.
Frequently Asked Questions
Why do mainstream financial news outlets only broadcast the Price Return index?
Legacy financial media broadcasts the standard price index (e.g., S&P 500 at 5,500) primarily for historical continuity and simplicity. The price index reflects immediate intraday market sentiment without requiring complex real-time algorithmic calculations of corporate dividend reinvestment cash flows.
How does currency exchange fluctuation affect the total return of international assets?
If an American investor buys a German stock that surges 20% in Euros, but the Euro simultaneously depreciates by 10% against the U.S. Dollar over the holding period, the investor’s net Dollar total return is compressed to approximately $10%$. International total return always equals the local asset total return plus or minus the currency exchange rate movement.
What is the Global Investment Performance Standards (GIPS) rule regarding total return?
Administered by the CFA Institute, the GIPS framework legally mandates that institutional asset managers and mutual funds must calculate and report historical investment performance exclusively using Total Return. Presenting price-only returns to prospective clients is considered an unethical and deceptive presentation of portfolio performance.
Ready to trade forex?
Open a free demo account with a regulated broker. Practice with virtual funds before risking real money.