Yield
Yield is the annual percentage return generated on an investment based on its cost or current market value, encompassing coupon payments, dividends, or interest relative to principal capital.
What Is Yield?
Yield represents the earnings generated and realized on an investment over a specific period, expressed as an annualized percentage of the investment’s cost, current market price, or face value.
In financial markets, yield is the fundamental metric used to compare the cash-flow generating power of different asset classes—including sovereign government bonds, corporate debentures, dividend-paying equities, and money market instruments. While capital appreciation (or depreciation) measures changes in an asset’s market price, yield focuses strictly on the regular income stream (dividends or interest coupons) returned to the investor relative to the capital deployed.
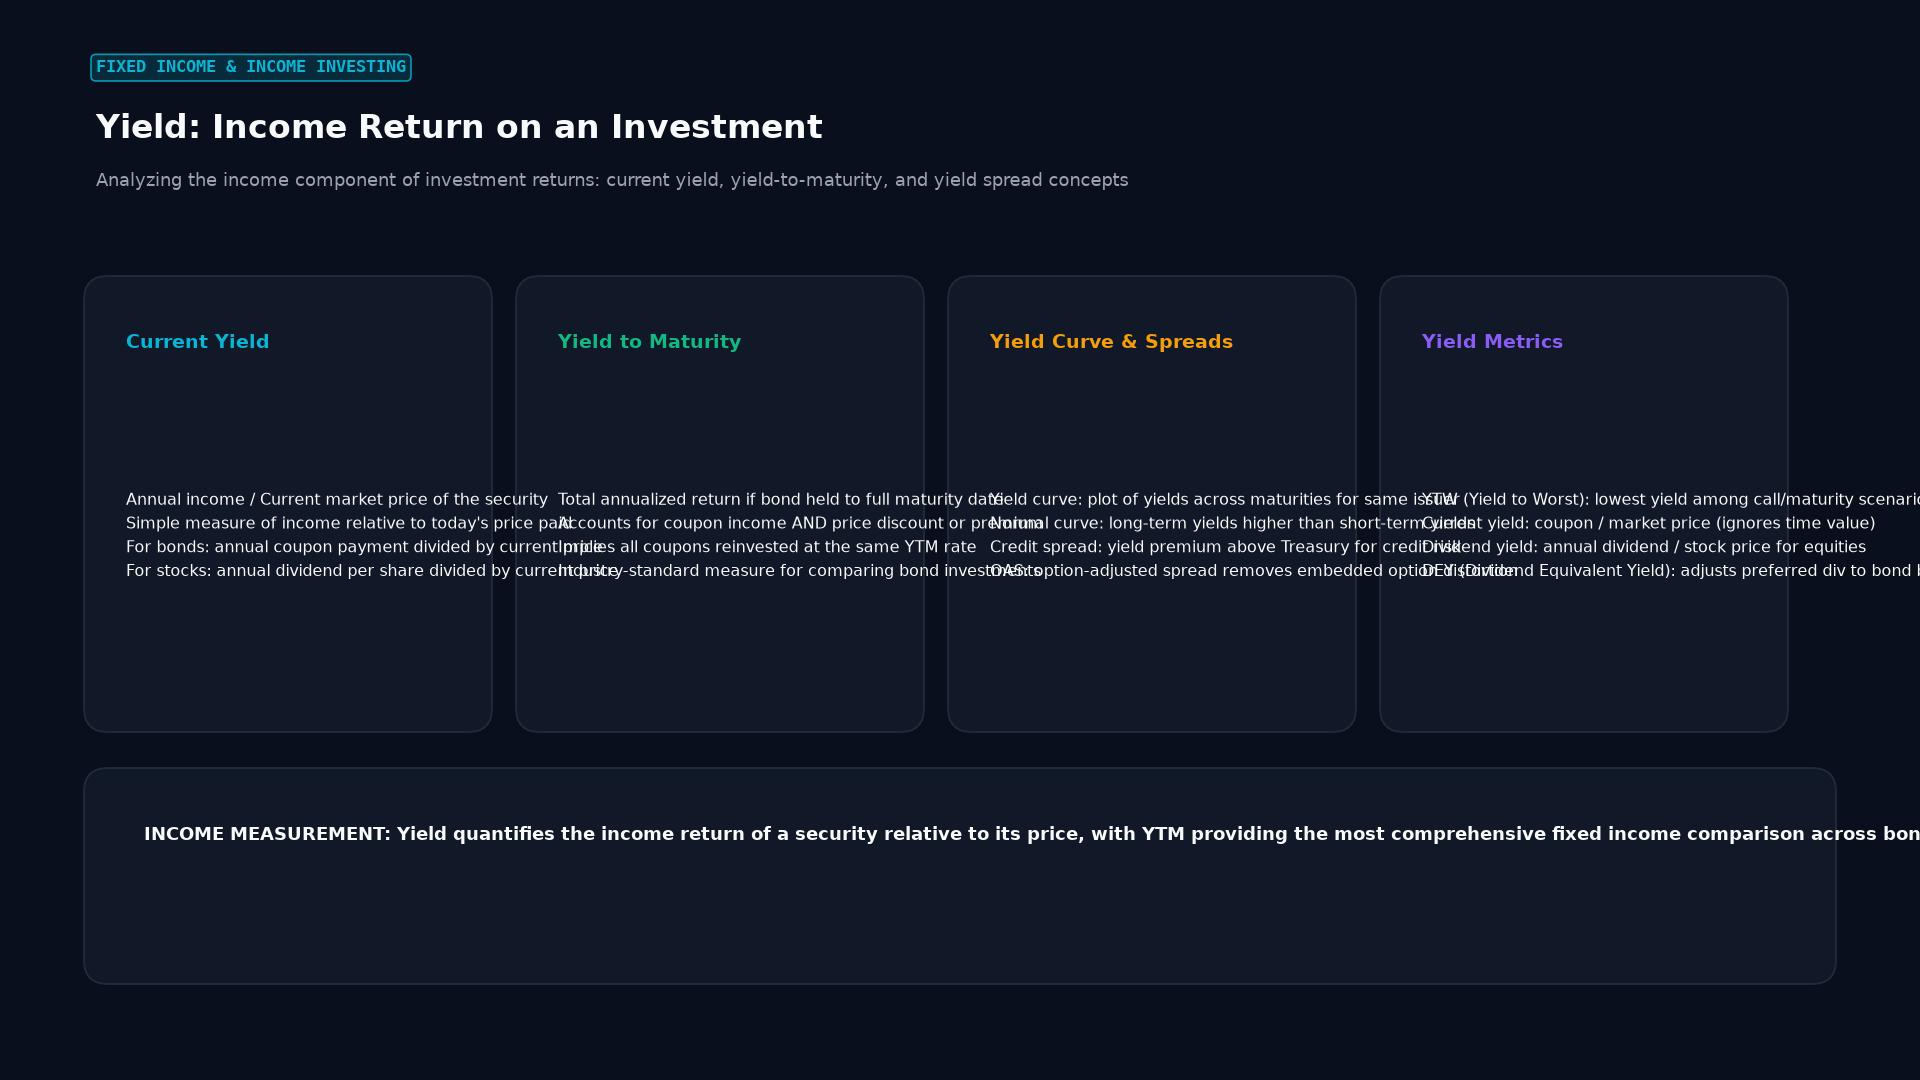 Figure: Analyzing the income component of investment returns: current yield, yield-to-maturity, and yield spread concepts
Technical Formulations: The Spectrum of Yield Metrics
Because bond prices trade at discounts or premiums to their par value in secondary markets, fixed-income analysts utilize multiple distinct yield calculations:
1. Nominal (Coupon) Yield
The fixed contractual interest rate stated on the face of the bond:
$$Y_{\text{nominal}} = \frac{\text{Annual Coupon Payment }(C)}{\text{Par Value }(F)} \times 100$$
2. Current Yield
Measures annual coupon income relative to the bond’s current secondary market price ($P$):
$$Y_{\text{current}} = \frac{C}{P} \times 100$$
3. Yield to Maturity (YTM)
The internal rate of return (IRR) of a bond held until maturity, assuming all scheduled coupons are paid and reinvested at the same rate:
$$P = \sum_{t=1}^{n} \frac{C}{(1 + y)^t} + \frac{F}{(1 + y)^n}$$
Where:
- $P$: Current market price of the bond.
- $C$: Periodic coupon payment.
- $F$: Face (par) value paid at maturity.
- $n$: Number of remaining coupon periods.
- $y$: Periodic yield to maturity (annualized by multiplying by payment frequency).
4. Real Yield (Fisher Equation)
The nominal yield adjusted for the erosion of purchasing power caused by inflation ($\pi$):
$$1 + y_{\text{nominal}} = (1 + y_{\text{real}})(1 + \pi) \implies y_{\text{real}} \approx y_{\text{nominal}} - \pi$$
Comparative Matrix: Fixed-Income Yield Measures
| Yield Type | Incorporates Current Price? | Factors Capital Gains/Losses? | Considers Call Risk? | Primary Use Case |
|---|---|---|---|---|
| Nominal Yield | No (Fixed par) | No | No | Marketing coupon rate |
| Current Yield | Yes | No (Ignores price at maturity) | No | Quick annual cash-flow screening |
| Yield to Maturity (YTM) | Yes | Yes (Accretes discount/premium) | No (Assumes full maturity) | Institutional fixed-income valuation |
| Yield to Worst (YTW) | Yes | Yes | Yes (Considers earliest call date) | Evaluating callable corporate bonds |
| Dividend Yield | Yes | No | No | Equity income comparison |
Real-World Case Study: The 2022–2023 Sovereign Yield Surge & USD/JPY
The macro relationship between sovereign bond yields and foreign exchange rates was illustrated during the global monetary tightening cycle of 2022–2023.
Macro Divergence (2022-2023):
- United States: The Federal Reserve aggressively hiked the Fed Funds rate to combat inflation, driving US 10-Year Treasury yields from 1.51% (Jan 2022) to a 16-year high of 5.02% (Oct 2023).
- Japan: The Bank of Japan (BOJ) maintained its Yield Curve Control (YCC) framework, capping Japanese 10-Year Government Bond (JGB) yields near 0.25% to 0.50%.
- Yield Spread Explosion: The 10-year US-Japan sovereign yield spread widened from 140 basis points to over 420 basis points.
- FX Transmission: Institutional global macro funds aggressively shorted the Yen to fund long USD carry positions. USD/JPY skyrocketed from 115.00 in early 2022 to over 151.90 in late 2023.
The currency pair tracked the 10-year sovereign bond yield spread with a statistical correlation exceeding 0.90, demonstrating that bond yield differentials are the dominant driver of international currency values.
Frequently Asked Questions (FAQ)
Why do bond prices and bond yields move in opposite directions?
A bond’s coupon payment is a fixed dollar amount determined at issuance. If prevailing market interest rates rise, new bonds are issued with higher coupon rates, making existing bonds with lower coupons less desirable. To entice buyers, the secondary market price of the existing bond must fall until its effective yield matches current market interest rates. Conversely, if market rates decline, existing higher-paying bonds become more valuable, driving their market prices up and their yields down.
What is the difference between yield and total return?
Yield reflects only the income stream (coupon interest or stock dividends) generated by an asset relative to its price, without considering changes in the asset’s underlying capital value. Total return, by contrast, encompasses both the income yield plus any realized or unrealized capital gains or capital losses resulting from price appreciation or depreciation over the holding period.
How do sovereign bond yield differentials dictate foreign exchange rates?
Global capital is inherently mobile and seeks the highest risk-adjusted returns. When sovereign bond yields in one country rise significantly above those in another (widening the yield differential), international investors and hedge funds execute carry trades—borrowing in the low-yielding currency to purchase the higher-yielding sovereign bonds. This capital rotation generates sustained spot buying pressure for the high-yielding currency, causing it to appreciate.
Ready to trade forex?
Open a free demo account with a regulated broker. Practice with virtual funds before risking real money.