Rate of Return
Rate of Return (RoR)—frequently termed Return on Investment (ROI)—is the percentage net financial gain or loss generated on an investment relative to its initial capital cost over a specified evaluation period.
What Is Rate of Return (RoR)?
In portfolio management, corporate finance, and individual trading, the Rate of Return (RoR) is the standard mathematical metric used to quantify the profitability or performance of an investment. It expresses the net change in an asset’s capital value—plus any cash distributions, dividends, or interest received—as a percentage of the original capital invested over a specific holding timeframe.
The fundamental formula for calculating standard (simple) Rate of Return is:
$$\text{Rate of Return (RoR)} = \left(\frac{\text{Ending Value} - \text{Initial Value} + \text{Income/Dividends}}{\text{Initial Value}}\right) \times 100%$$
While straightforward for static, single-period investments, evaluating institutional portfolios that experience continuous client capital deposits, withdrawals, and compounding across multiple years requires sophisticated methodologies—including the Compound Annual Growth Rate (CAGR), Time-Weighted Return (TWR), and Money-Weighted Return (MWR).
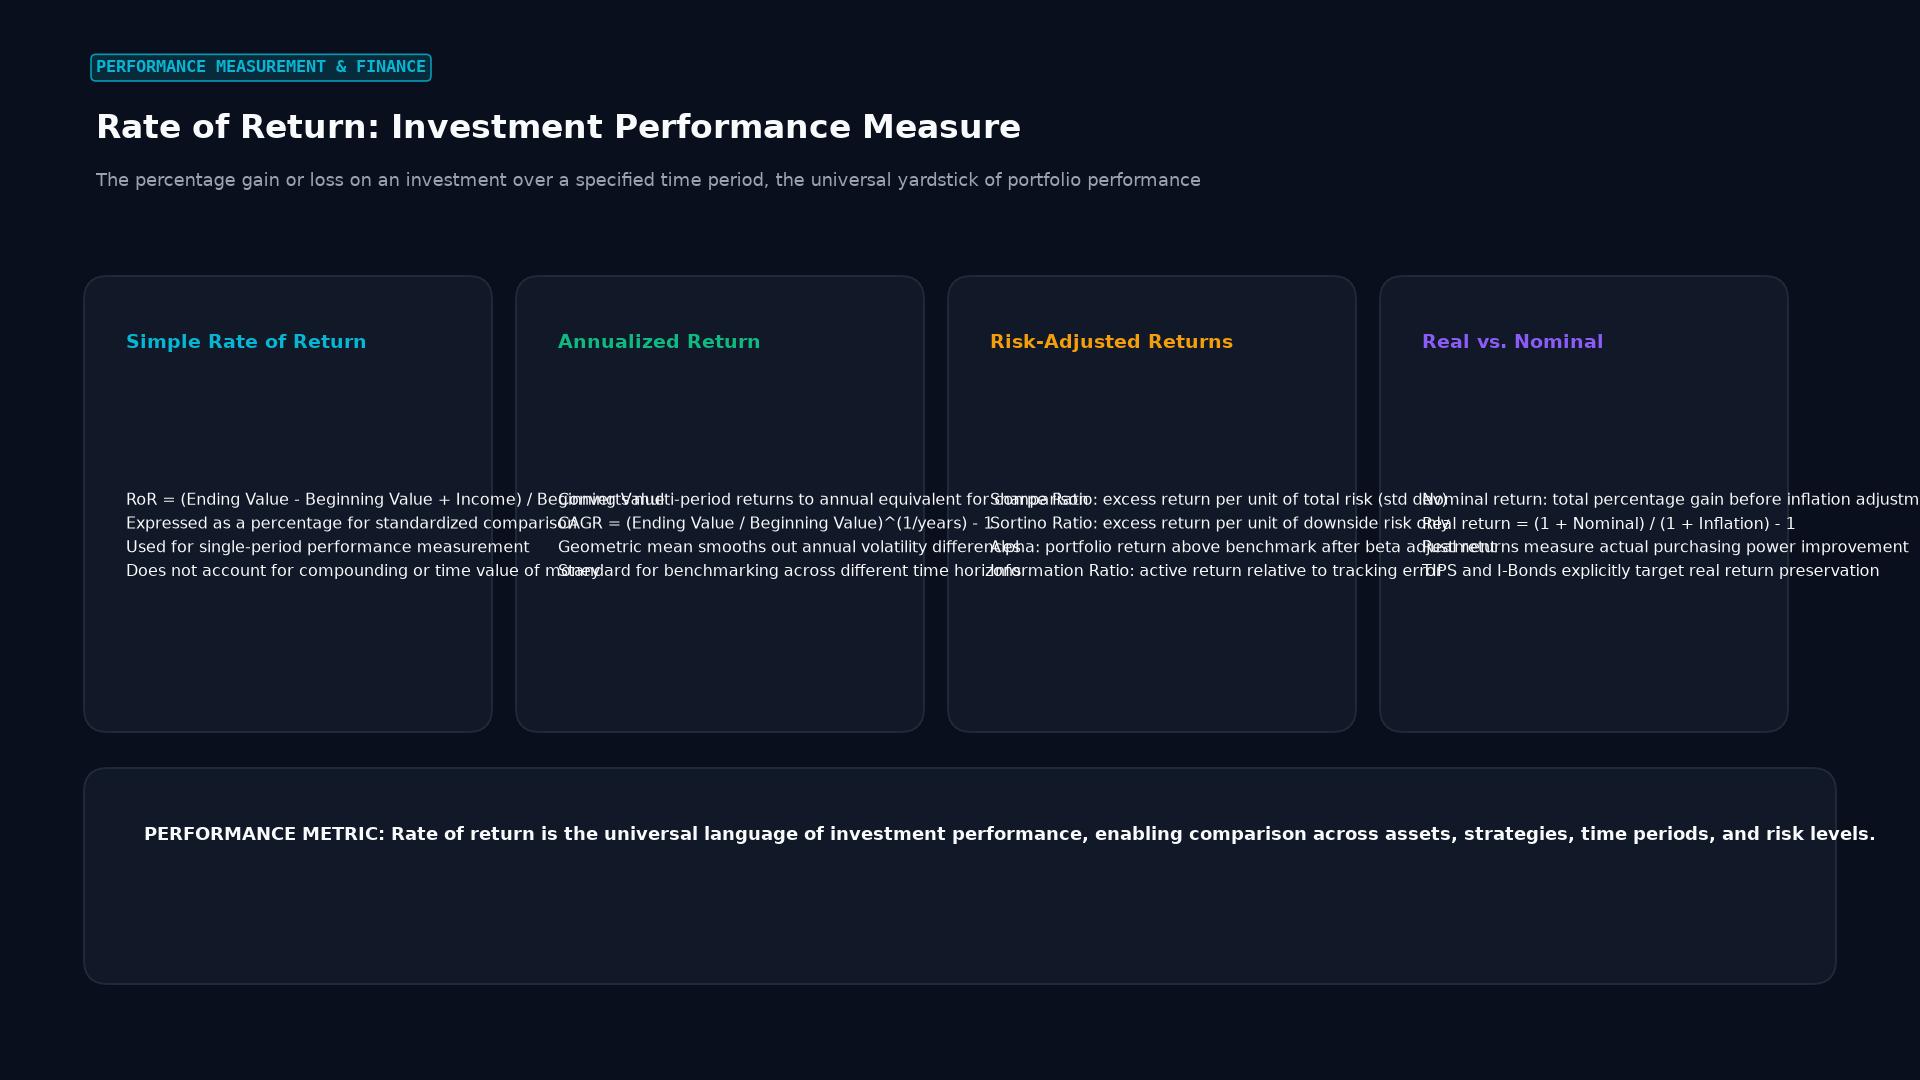 Figure: The percentage gain or loss on an investment over a specified time period, the universal yardstick of portfolio performance
Core Variations of Rate of Return
Financial analysts evaluate returns through distinct structural lenses depending on inflation, time horizons, and compounding:
1. Nominal Return vs. Real Rate of Return
- Nominal Rate of Return: The headline percentage gain in currency terms, without adjusting for changes in purchasing power.
- Real Rate of Return: Adjusts nominal performance for the eroding effects of inflation ($\pi$). Using the exact Fisher Equation: $$1 + r_{\text{real}} = \frac{1 + r_{\text{nominal}}}{1 + \pi} \implies r_{\text{real}} \approx r_{\text{nominal}} - \pi$$ If a trading portfolio gains 10% in a year where inflation is 7%, the investor’s real rate of return is only ~3%.
2. Compound Annual Growth Rate (CAGR)
Because annual returns vary widely year to year, calculating the arithmetic mean produces a distorted upward bias. Institutional allocators calculate the geometric mean (CAGR) to represent the smoothed annual compound growth rate over $n$ years:
$$\text{CAGR} = \left(\frac{\text{Ending Portfolio Value}}{\text{Beginning Portfolio Value}}\right)^{\frac{1}{n}} - 1$$
Time-Weighted Return (TWR) vs. Money-Weighted Return (MWR)
When external cash is deposited or withdrawn from a fund mid-year, calculating rate of return becomes complex:
| Metric | Calculation Philosophy | Sensitivity to Cash Flows | Primary Regulatory / Practical Application |
|---|---|---|---|
| Time-Weighted Return (TWR) | Breaks the evaluation period into sub-periods based on the timing of cash flows, compounding geometric sub-returns: $R_{\text{TWR}} = \prod (1 + R_i) - 1$. | Zero sensitivity to cash flows: Completely isolates manager skill from timing of client deposits. | Global Investment Performance Standards (GIPS): Mandatory for mutual funds and institutional asset managers. |
| Money-Weighted Return (MWR / IRR) | Calculates the Internal Rate of Return (IRR) that equates the present value of all cash inflows and outflows to the ending portfolio balance. | Highly sensitive: Heavily weights performance during periods when total capital under management is highest. | Measures the actual bottom-line return experienced by the individual investor. |
Risk-Adjusted Rates of Return: Beyond Raw Percentages
In quantitative finance, evaluating a rate of return without evaluating the risk taken to achieve it is meaningless. A 20% annual return achieved through 1:100 leverage with an 80% maximum drawdown is vastly inferior to a 12% return achieved with minimal volatility.
Key Risk-Adjusted Ratios:
- The Sharpe Ratio: Measures excess return over the risk-free rate per unit of total portfolio volatility (standard deviation, $\sigma$): $$\text{Sharpe Ratio} = \frac{R_p - R_f}{\sigma_p}$$
- The Sortino Ratio: Evaluates excess return relative strictly to downside volatility ($\sigma_d$), ignoring upside volatility: $$\text{Sortino Ratio} = \frac{R_p - R_f}{\sigma_d}$$
- The Calmar Ratio: Compares annualized return to the portfolio’s Maximum Historical Drawdown (MDD), widely used in hedge funds and automated CTA strategies: $$\text{Calmar Ratio} = \frac{\text{Annualized Return}}{|\text{Maximum Drawdown}|}$$
Real-World Case Study: The TWR vs. MWR Divergence
In 2020, an aggressive technology growth fund delivered a blockbuster 100% annual return:
- Period 1 (Jan–June): The fund manager started with $10,000,000 in assets under management (AUM). In the first six months, the fund surged +100%, doubling to $20,000,000.
- The Inflow Shock: Impressed by the sensational performance, new retail investors poured $80,000,000 in new cash into the fund on July 1, bringing total AUM to $100,000,000.
- Period 2 (July–Dec): In the second half of the year, tech equities suffered a correction, and the fund declined -20%, ending the year with $80,000,000.
- The Performance Disparity:
- Time-Weighted Return (Manager’s Skill): $$R_{\text{TWR}} = (1 + 1.00) \times (1 - 0.20) - 1 = 2.00 \times 0.80 - 1 = \mathbf{+60%}$$ The fund manager legally advertises a stellar +60% GIPS-compliant return.
- Money-Weighted Reality (Investors’ Loss): $$\text{Period 1 Gain} = +$10{,}000{,}000$$ $$\text{Period 2 Loss} = -20% \times $100{,}000{,}000 = -$20{,}000{,}000$$ $$\text{Net Aggregate Dollar Loss} = \mathbf{-$10{,}000{,}000}$$
- Despite the manager claiming a +60% annual return, the collective investor community lost $10 million in actual cash, illustrating why sophisticated allocators analyze both TWR and MWR.
Frequently Asked Questions
What is the difference between Rate of Return and Yield?
- Rate of Return (Total Return): Measures total net profit from all sources—including both price capital appreciation (or depreciation) and income distributions.
- Yield: Measures strictly the ongoing income cash flows (such as bond coupon payments or stock dividends) generated by an asset as a percentage of its price, ignoring capital gains or losses.
What is a good annual Rate of Return for a trader?
For broad equity markets, the historical long-term average nominal rate of return of the S&P 500 is approximately 10% annualized (~7% real return after inflation). Top institutional hedge funds aim for consistent 12% to 20% annualized returns with low drawdowns and high Sharpe ratios (> 1.5).
What does “Annualized Rate of Return” mean?
An annualized return scales an investment’s cumulative return from a shorter or longer time period into an equivalent standard 1-year rate. For example, if a trade earns 3% over a 30-day period, its annualized return is: $$\text{Annualized} \approx 3% \times \left(\frac{365}{30}\right) \approx 36.5%$$
Ready to trade forex?
Open a free demo account with a regulated broker. Practice with virtual funds before risking real money.