Trade Price Response
A market microstructure concept describing the immediate, observable behavioral and algorithmic reaction of market makers, resting order book liquidity, and participant order flow when an asset reaches a specific price benchmark or executes a block trade.
What Is a Trade Price Response?
In market microstructure and institutional order flow analysis, a trade price response refers to the measurable reaction of market participants, automated execution algorithms, and the limit order book when an asset reaches a critical price threshold or executes a significant block order.
The concept is founded on a core tenet of modern electronic trading: price does not move in a vacuum. When an asset trades at a specific price—particularly a major technical support/resistance shelf, a daily opening level, or a round institutional psychological barrier (e.g., EUR/USD 1.1000)—market participants react in predictable, probabilistic ways:
- Passive Liquidity Providers may replenish resting limit orders, absorbing the incoming flow.
- Aggressive Momentum Traders may interpret the price touch as a breakout trigger, flooding the book with market orders.
- Counter-Trend Scalpers may aggressively fade the level, forcing an immediate V-reversal.
Analyzing the speed, volume, and order-book depth of the trade price response allows professional traders to deduce whether institutional “smart money” is actively accumulating, distributing, or stepping aside.
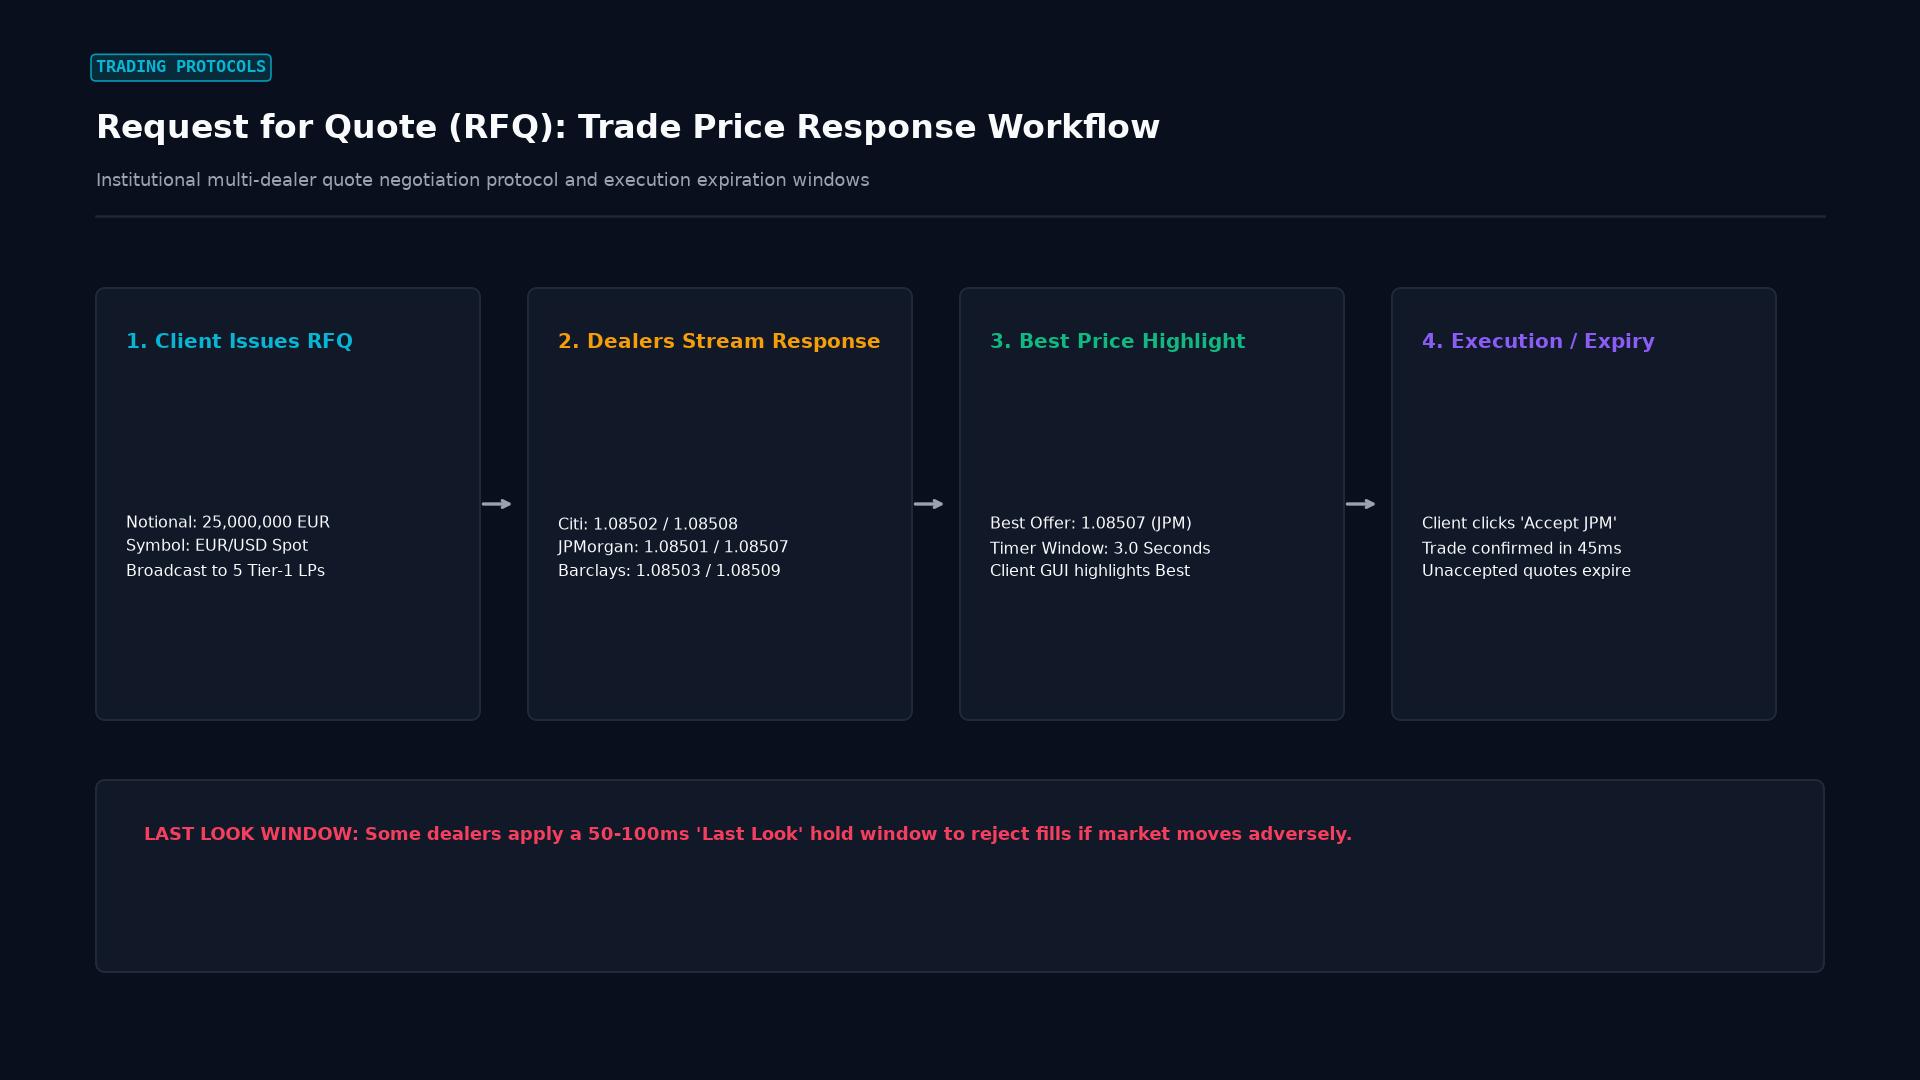 Figure: RFQ negotiation protocol: client quote request, multi-dealer streaming price responses, best-price highlights, and execution timer windows.
Quantitative Modeling of Trade Price Responses
Quantitative finance models the trade price response as an empirical price impact function, measuring how the market price changes over successive time increments ($l$) following an executed order:
$$R(l) = \mathbb{E}\left[ P_{t+l} - P_t ;\middle|; \text{Trade at time } t \text{ with sign } \epsilon_t \text{ and size } Q \right]$$
Where:
- $P_t$: Price at the moment of execution.
- $P_{t+l}$: Price $l$ ticks or milliseconds after the trade.
- $\epsilon_t$: Trade sign ($+1$ for buyer-initiated trades, $-1$ for seller-initiated trades).
- $Q$: Notional volume of the transaction.
Permanent vs. Temporary Price Response
Microstructure quants divide the trade price response into two components:
- Temporary Price Response (Transient Impact): Driven by immediate order book depletion and liquidity friction. Once high-frequency market makers replenish the book, this price displacement snaps back toward the baseline (mean-reversion).
- Permanent Price Response (Informed Trading Impact): Driven by superior institutional information. The market recognizes that the trade reflects genuine fundamental value changes, permanently re-pricing the asset to a new equilibrium level.
Three Primary Archetypes of Trade Price Responses
By monitoring Depth of Market (DOM) software and footprint volume charts, traders categorize price responses into three behavioral patterns:
| Price Response Type | Order Book Behavior | Volume Profile | Actionable Trader Interpretation |
|---|---|---|---|
| Passive Absorption | Heavy resting limit orders absorb incoming market orders; price holds tight | Surging volume with minimal price displacement | Institutional accumulation/distribution; prepare for reversal |
| Sharp Rejection (Pin Bar) | Aggressive counter-orders enter immediately upon level touch | High volume spike followed by immediate liquidity vacuum | Key technical support/resistance confirmed; high-probability bounce |
| Momentum Vacuum (Breakout) | Liquidity providers pull limit orders; market sweeps multiple empty tiers | Moderate volume produces massive directional price bars | Structural failure of the level; enter in direction of breakout |
Real-World Institutional Case Study: Algorithmic Probing at the London 4:00 PM Fix
The world’s most heavily scrutinized trade price response occurs daily around the WM/Refinitiv London 4:00 PM Fix, the benchmark exchange rate used by global index funds to calculate portfolio net asset values:
       LONDON FIX PRICE RESPONSE PROBING (15:45 - 16:00 GMT)

 15:45 GMT: Algorithmic market-making desks begin submitting small "probing"
            orders into the EUR/USD order book.

 The Trade Price Response Observation:
 - If small buy orders easily push the price upward with zero resting limit offers,
   algorithms recognize that the impending Fix flow is OVERWHELMINGLY BUYING.
 - If small buy orders are instantly absorbed by massive passive limit offers,
   algorithms deduce that massive institutional selling is resting in the book.

 15:55 GMT: Institutional desks align proprietary positioning with the observed
            trade price response, front-running the multi-billion-dollar fixing window.
Practical Trading Rules: Exploiting Trade Price Responses
- Never Trade the Level Blindly: Novice traders place resting limit orders at support levels without waiting to see how the market reacts. Professional traders wait for the price to touch the level and observe the trade price response—confirming absorption or rejection—before entering.
- Watch the Speed of the Tape: A sluggish, hesitant response to a level indicates low institutional interest, increasing the risk of a breakdown. A violent, instantaneous rejection confirms active institutional sponsorship.
- Analyze Footprint Delta: On order flow footprint charts, examine whether delta (the net difference between buyer-initiated and seller-initiated market orders) matches price movement. If heavy negative delta fails to push prices lower, massive passive buying is absorbing the selling, signaling an imminent upward explosion.
Frequently Asked Questions
What is the difference between “Trade Price Response” and general “Price Action”?
Price action is the broad, macro visual study of price movement across candlestick bars over extended timeframes (e.g., chart patterns, trends, swing highs/lows). Trade price response is a granular market microstructure concept focusing on the microsecond-by-microsecond interaction between executed market orders and resting order-book depth at specific price points.
How do high-frequency algorithms exploit trade price responses?
HFT algorithms submit small test orders (“pinging”) across various price levels to gauge the order book’s reaction. By measuring whether resting liquidity absorbs the orders or evaporates, algorithms detect hidden institutional iceberg orders and predict short-term directional price moves before slower market participants can react.
Can retail traders observe trade price responses without institutional software?
Yes. Retail traders can observe trade price responses on standard charting platforms by analyzing candlestick wick reactions and tick volume on 1-minute and 5-minute charts. An elongated wick formed on surging volume at a key horizontal line indicates a powerful institutional trade price rejection.
Ready to trade forex?
Open a free demo account with a regulated broker. Practice with virtual funds before risking real money.