Yield on Cost - YoC
A dividend investment metric that measures the annual dividend income generated by an asset as a percentage of the investor's original purchase cost basis, frequently utilized in dividend growth investing.
Yield on Cost (YoC)
In equity portfolio management, personal financial planning, and dividend growth investing (DGI), Yield on Cost (commonly abbreviated as YoC) is a performance metric that calculates the annual dividend or distribution income generated by a security as a percentage of the investor’s original purchase price (or adjusted tax cost basis).
Unlike the conventional Current Dividend Yield, which fluctuates inversely with daily stock market price movements, Yield on Cost remains historically anchored to the specific capital commitment made at the time of initial investment. As a company steadily expands its cash dividend payouts over a multi-year or multi-decade holding period, an investor’s Yield on Cost rises progressively, illustrating the compounding income potential of dividend-growing blue-chip equities, Real Estate Investment Trusts (REITs), and Master Limited Partnerships (MLPs).
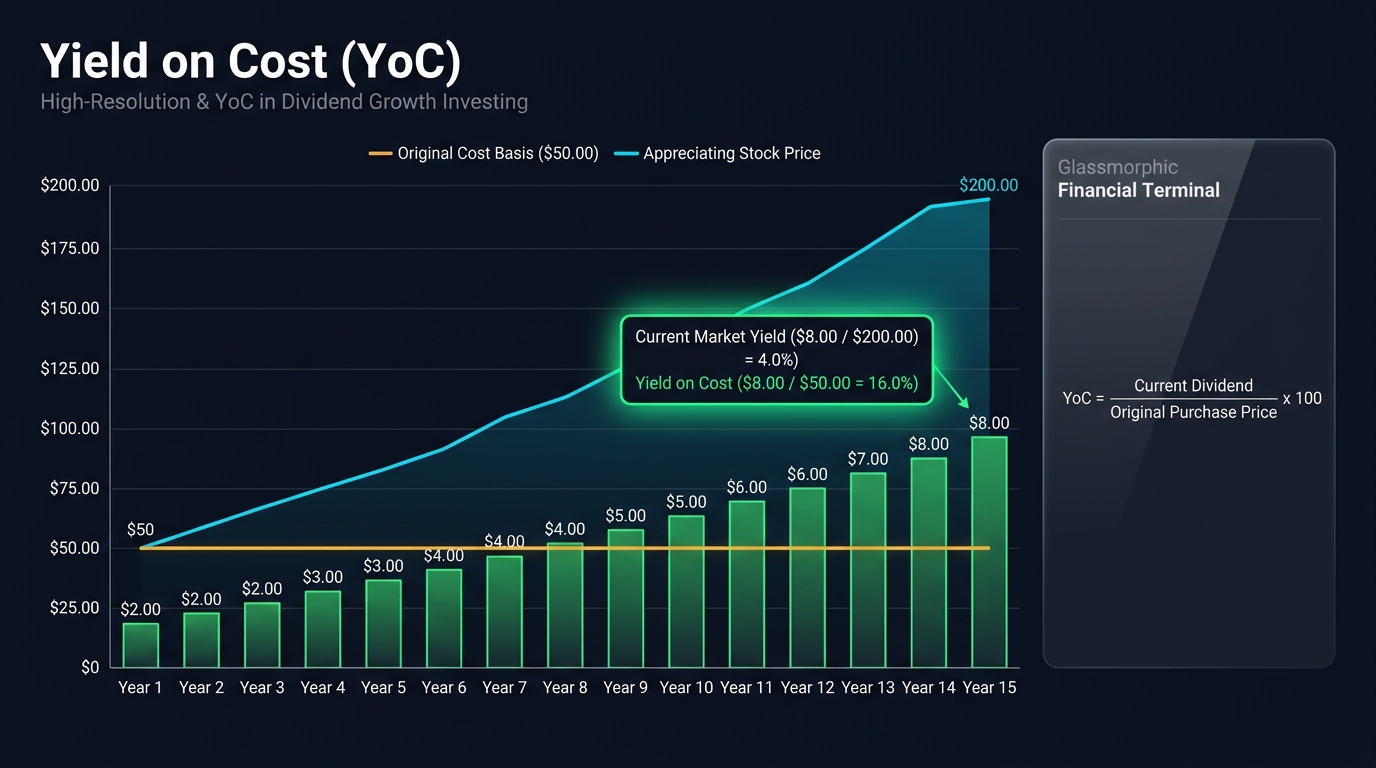
       +-------------------------------------------------------------+
       |             The Mathematical Anatomy of Yield on Cost       |
       +-------------------------------------------------------------+
                                      |
            +-------------------------+-------------------------+
            |                                                   |
            v                                                   v
+-------------------------+                         +-------------------------+
| Current Annual Dividend |                         | Original Purchase Price |
| (Growing over time)     |                         | (Fixed historical basis)|
| e.g., $8.00 per share   |                         | e.g., $50.00 per share  |
+------------+------------+                         +------------+------------+
             |                                                   |
             +-------------------------+-------------------------+
                                       v
                   +---------------------------------------+
                   | Yield on Cost Formula:                |
                   | YoC = (Annual Dividend / Cost Basis)  |
                   | YoC = ($8.00 / $50.00) * 100 = 16.0%  |
                   +---------------------------------------+
                                       |
                   Compared to Current Market Yield:
                   If Stock Price is now $200.00:
                   Current Yield = ($8.00 / $200.00) = 4.0%
Mathematical Formulation and Calculation
The formula for calculating Yield on Cost is mathematically straightforward:
1. Basic Single-Share Formula
$$\text{Yield on Cost (YoC)} = \left(\frac{\text{Current Annualized Dividend per Share}}{\text{Original Purchase Price per Share}}\right) \times 100$$
2. Aggregate Portfolio Position Formula
When multiple tranches of shares are accumulated over time, the metric is calculated on an aggregate position basis: $$\text{Yield on Cost} = \left(\frac{\text{Total Annual Dividend Cash Received}}{\text{Total Cumulative Cost Basis}}\right) \times 100$$ $$\text{Where: } \text{Total Cumulative Cost Basis} = \sum_{i=1}^{n} (\text{Shares Purchased}_i \times \text{Purchase Price}_i) + \text{Transaction Commissions}$$
3. Adjusting for Stock Splits and Spin-Offs
Corporate actions require mathematical adjustments to the historical cost basis:
- Forward Stock Split (e.g., 2-for-1): The number of shares doubles, and the cost basis per share is cut in half: $$\text{Adjusted Cost Basis} = \frac{\text{Original Cost Basis}}{2}$$
- The aggregate dollar cost basis of the position remains unchanged, ensuring the calculated YoC accurately reflects total cash returns.
Detailed Comparison: Yield on Cost vs. Current Dividend Yield
Understanding the fundamental distinctions between Yield on Cost and Current Dividend Yield is critical for institutional asset allocators and retail income investors:
| Feature / Dimension | Yield on Cost (YoC) | Current Dividend Yield |
|---|---|---|
| Denominator | Historical Purchase Price (Cost Basis) | Current Market Price of the Stock |
| Variability | Fixed denominator; changes only with dividend hikes | Changes continuously every trading second |
| Primary Utility | Tracks personal historical cash-on-cash return | Evaluates current market pricing & opportunity cost |
| Comparability | Highly subjective (unique to each individual buyer) | Standardized across all global market participants |
| Capital Allocation Role | Irrelevant for new capital decisions | Crucial for current capital deployment |
| Psychological Value | High (encourages long-term buy-and-hold discipline) | Neutral (pure objective market pricing) |
+------------------------------------------------------------------------+
|          The Divergence Between YoC and Market Yield Over Time         |
+------------------------------------------------------------------------+
| Year | Market Price | Annual Dividend | Current Market Yield | Yield on Cost (Base $50) |
| Yr 0 | $50.00       | $1.50           | 3.00%                | 3.00%                    |
| Yr 5 | $85.00       | $2.55           | 3.00%                | 5.10%                    |
| Yr 10| $140.00      | $4.20           | 3.00%                | 8.40%                    |
| Yr 15| $230.00      | $6.90           | 3.00%                | 13.80%                   |
| Yr 20| $380.00      | $11.40          | 3.00%                | **22.80%**               |
+------------------------------------------------------------------------+
(In this example, assuming a stock compounds both price and dividends at a 10% annual rate, the current market yield remains steady at 3.0%, while the investor’s personal Yield on Cost climbs from 3.0% to 22.8% on original capital.)
Analytical Critique: The “Sunk Cost Fallacy” Hazard
While Yield on Cost is widely celebrated in retail financial media and dividend blogging communities, professional institutional asset managers and quantitative economists treat YoC with caution due to several significant analytical limitations:
1. The Sunk Cost Fallacy
In modern microeconomics, rational investment decisions must be made by evaluating future expected returns and current opportunity costs, completely ignoring past sunk costs:
- An investor holding a stock purchased 20 years ago at $10 that now trades at $100 and pays a $5 dividend may boast of a 50% Yield on Cost ($5 / $10).
- However, the investor’s actual capital at risk today is $100 per share, not $10. On that $100 of current market wealth, the asset is generating a current yield of only 5.0%.
- If a competing investment of identical risk yields 7.0%, holding onto the stock purely because of an emotionally satisfying 50% YoC represents suboptimal capital allocation.
2. Disregard for Total Return and Inflation
Yield on Cost measures cash dividend velocity but completely ignores capital gains, losses, and real purchasing power:
- A stock could pay an increasing nominal dividend while its underlying market price collapses due to deteriorating business fundamentals.
- An investor who purchased a stock for $100 that now trades at $30 while paying a $4 dividend achieves a 4% YoC, but suffers an unrecovered 70% unrealized capital loss.
- Professional portfolio evaluation requires measuring Total Return (Capital Gains + Reinvested Dividends) against risk-free sovereign benchmarks, rather than focusing exclusively on income yield on historical cost.
Strategic Value: The Behavioral Finance Anchor
Despite its economic limitations for forward-looking capital allocation, Yield on Cost possesses significant behavioral finance value:
- Combating Panic Selling: During severe market crashes (such as 2008 or 2020), retail investors are prone to emotional capitulation. Tracking Yield on Cost reminds the long-term investor that their cash-flow generation stream remains intact, transforming bear markets into opportunities to lower the average cost basis.
- Encouraging Patient Compounding: YoC demonstrates the long-term payoff of Dividend Aristocrats (companies that have increased dividends for 25+ consecutive years), incentivizing investors to resist short-term speculative trading.
Applied Investment Case Study: Warren Buffett and Coca-Cola
The most celebrated real-world example of Yield on Cost in modern financial history is Berkshire Hathaway’s investment in The Coca-Cola Company (KO):
Historical Capital Commitment
- Between 1988 and 1994, Warren Buffett’s Berkshire Hathaway accumulated 400,000,000 shares (split-adjusted) of Coca-Cola for a total cumulative cost basis of approximately $1,299,000,000.
- Average Cost Basis per Share: $$\text{Cost Basis} = \frac{$1,299,000,000}{400,000,000 \text{ shares}} \approx $3.2475 \text{ per share}$$
Cash Dividend Growth
Over the subsequent three decades, Coca-Cola expanded its global distribution footprint and increased its cash dividend payout every single year:
- By 2024, Coca-Cola paid an annualized dividend of $1.94 per share.
- Total Annual Cash Flow Received by Berkshire: $$400,000,000 \text{ shares} \times $1.94 = \mathbf{$776,000,000 \text{ per year}}$$
Yield on Cost Calculation
$$\text{Buffett’s Yield on Cost} = \left(\frac{$1.94}{$3.2475}\right) \times 100 \approx \mathbf{59.74%}$$
- Berkshire Hathaway collects nearly 60% of its entire original investment in cash dividends every single year, while retaining complete ownership of an equity stake valued at over $25 billion.
Frequently Asked Questions
Does Yield on Cost change if an investor reinvests their dividends (DRIP)?
Yes. If an investor enrolls in a Dividend Reinvestment Plan (DRIP), the cash dividends are automatically used to purchase additional shares at the prevailing market price. This increases the total cumulative dollar cost basis of the position. Because the new shares are typically purchased at higher prices than the original investment, reinvesting dividends usually lowers the position’s calculated average Yield on Cost in the short term, even though it accelerates total long-term wealth accumulation.
Can Yield on Cost be negative?
No. Because an asset’s cost basis and cash dividend payments are both positive numbers, Yield on Cost cannot be mathematically negative. If a company eliminates its dividend entirely (cuts dividend to zero), the Yield on Cost drops to 0.0%.
Should an investor sell a stock with a high Yield on Cost?
An investor should base their decision on current fundamentals and opportunity cost, not on their historical Yield on Cost. If a company’s competitive advantage has eroded, its debt load is unsustainable, or its dividend payout ratio is dangerously exceeding free cash flow, the investor should consider selling, regardless of how high their historical YoC appears. Capital should always be deployed where it generates the highest risk-adjusted total expected return today.
Ready to trade forex?
Open a free demo account with a regulated broker. Practice with virtual funds before risking real money.