Zacks Investment Research
An independent equity research and financial analytics firm founded in 1978, renowned for pioneering quantitative models based on earnings estimate revisions, the proprietary Zacks Rank stock rating system, and empirical factor testing.
What Is Zacks Investment Research?
Zacks Investment Research is an independent financial data, quantitative research, and analytics firm founded in 1978 by Len Zacks, a Ph.D. in Operations Research from the Massachusetts Institute of Technology (MIT). The firm is widely recognized across institutional and retail investment communities for establishing the foundational link between sell-side earnings estimate revisions and subsequent short- to medium-term equity price performance.
Prior to Len Zacks’ pioneering empirical research in the late 1970s, mainstream equity analysis focused heavily on static accounting metrics, such as trailing price-to-earnings (P/E) ratios or balance sheet book value. Zacks demonstrated mathematically that upward revisions in Wall Street consensus earnings per share (EPS) estimates act as the single most powerful quantitative catalyst driving stock price outperformance over a 1 to 6 month investment horizon.
Operating entirely independent of investment banking, securities underwriting, or corporate advisory operations, Zacks provides unbiased quantitative equity screening tools, consensus estimates, and proprietary ranking algorithms used by asset managers, hedge funds, and self-directed investors globally.
The Core Philosophy: Earnings Estimate Revisions
The intellectual foundation of Zacks Investment Research rests on a verified market anomaly known in academic literature as the Post-Earnings-Announcement Drift (PEAD) and institutional analyst herd behavior.
Wall Street brokerage analysts employ complex discounted cash flow (DCF) and operational models to project quarterly corporate profitability. However, because of reputational risk and institutional conservatism, analysts rarely adjust their financial forecasts in isolated, sweeping moves. When a company’s business fundamentals improve:
- One lead analyst raises their quarterly and fiscal-year EPS projections.
- Competing analysts re-evaluate their models and sequentially follow suit, creating an upward consensus trajectory.
- Institutional portfolio managers, constrained by investment mandates tied to forward earnings multiples, must reallocate capital toward these upgrading securities to avoid tracking error.
- This systematic institutional buying exerts sustained upward buying pressure on the stock over several months.
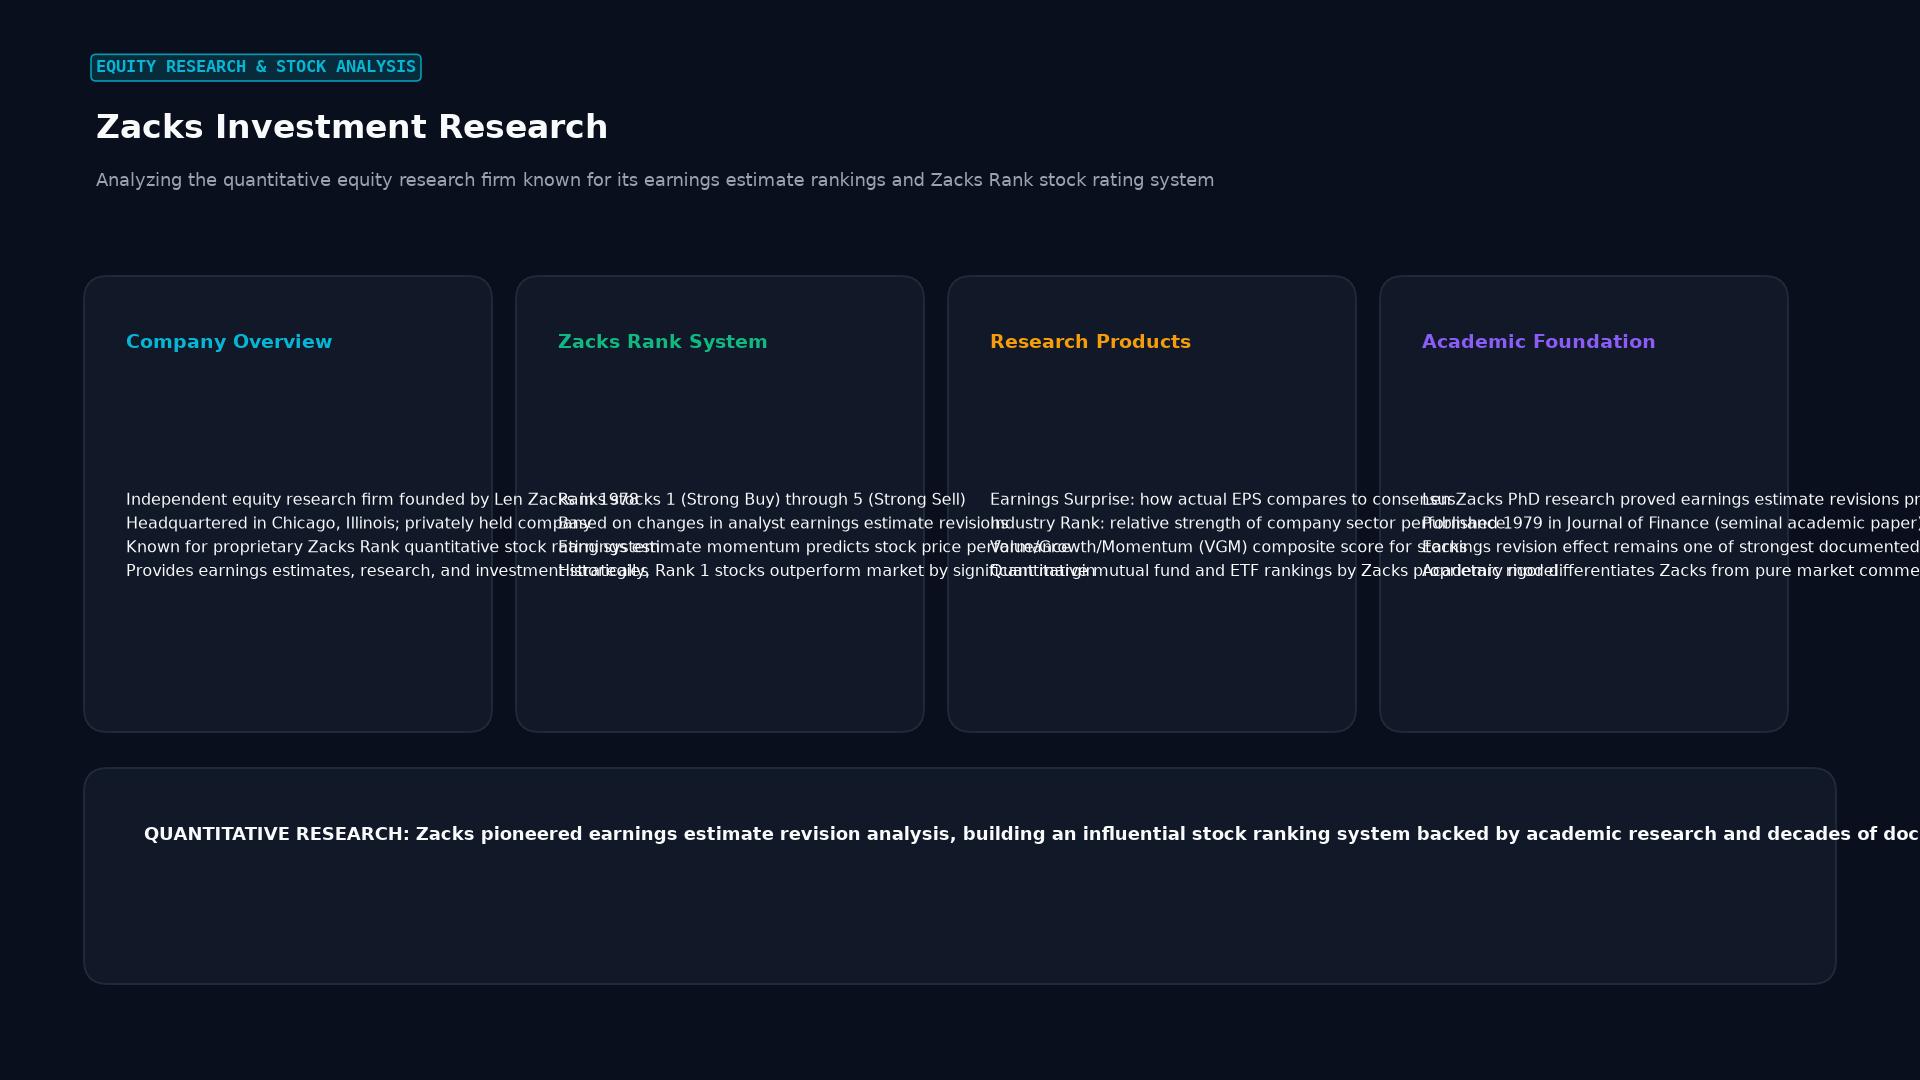 Figure: Analyzing the quantitative equity research firm known for its earnings estimate rankings and Zacks Rank stock rating system
The Zacks Rank System: Structure and Distribution
At the center of Zacks’ analytical product suite is the Zacks Rank, a quantitative model that classifies approximately 4,000 public equities into five distinct tiers based on their earnings estimate momentum. The model operates as a zero-sum, relative-ranking engine with a forced bell-curve distribution recalculated every single trading day:
                            ZACKS RANK DISTRIBUTION (DAILY)

     Rank #1: Strong Buy  (Top 5%  ~220 Stocks)   ▲ Best Expected Outperformance
     Rank #2: Buy         (Top 15% ~650 Stocks)   │
     Rank #3: Hold        (Mid 60% ~2,600 Stocks) │ Neutral Expected Return
     Rank #4: Sell        (Low 15% ~650 Stocks)   │
Rank #5: Strong Sell (Low 5% ~220 Stocks) ▼ Underperformance Candidate| Zacks Rank | Classification | Universe Proportion | Investment Recommendation |
|---|---|---|---|
| Rank #1 | Strong Buy | Top 5% (~220 companies) | Highest conviction outperformance over 1 to 3 months |
| Rank #2 | Buy | Next 15% (~650 companies) | Above-average market outperformance potential |
| Rank #3 | Hold | Middle 60% (~2,600 companies) | In-line performance matching the broader market benchmark |
| Rank #4 | Sell | Lower 15% (~650 companies) | Below-average performance; candidates for portfolio trimming |
| Rank #5 | Strong Sell | Bottom 5% (~220 companies) | Severe negative revision risk; prime short-selling or exit candidates |
The Four Quantitative Pillars of the Zacks Rank
The mathematical engine driving the Zacks Rank evaluates four core input factors, each designed to capture distinct nuances in sell-side analyst revisions:
                      ZACKS RANK QUANTITATIVE ENGINE

        ┌─────────────────────────┬─────────────────────────┐
        ▼                         ▼                         ▼
   [AGREEMENT]               [MAGNITUDE]                [UPSIDE]
Extent of consensus      Absolute percentage      Difference between
direction across all     change in consensus      Most Accurate Estimate
brokerage analysts       EPS over 30/60 days      and standard consensus
        │                         │                         │
        └─────────────────────────┼─────────────────────────┘
                                  ▼
                             [SURPRISE]
                        Historical frequency and
                        magnitude of quarterly
                        positive EPS surprises
                                  │
                                  ▼
                      [Final Proprietary Score]
                                  │
                                  ▼
[Assigned Zacks Rank: 1 to 5]- Agreement: Measures the degree of consensus among covering analysts. If six analysts cover a stock and all six revise their EPS estimates upward within the last 30 days, the agreement factor reaches maximum strength. A mixed distribution of revisions yields a lower composite score.
- Magnitude: Quantifies the percentage change in the consensus figure. A revision raising consensus full-year EPS from $2.00 to $2.30 (+15%) generates significantly higher factor weighting than an incremental bump from $2.00 to $2.02 (+1%).
- Upside: Compares the Most Accurate Estimate (a proprietary Zacks calculation focusing exclusively on the most recent revisions by top-performing analysts) against the broader consensus estimate. A positive divergence indicates that the consensus figure is lagging behind reality and will likely be revised higher soon.
- Surprise: Assesses the historical quarterly earnings beat/miss track record. Companies that systematically beat consensus estimates over the trailing four quarters receive an empirical boost, reflecting management’s conservative guidance discipline and operational execution.
Expected Surprise Prediction (ESP) and Style Scores
Beyond the general 1-to-5 Rank, Zacks incorporates specialized quantitative tools designed for event-driven and multi-style portfolio managers:
Earnings ESP (Expected Surprise Prediction)
The Earnings ESP formula identifies equities with the highest statistical probability of beating upcoming quarterly earnings announcements:
$$\text{Earnings ESP} = \left( \frac{\text{Most Accurate Estimate} - \text{Zacks Consensus Estimate}}{|\text{Zacks Consensus Estimate}|} \right) \times 100$$
When a stock possesses both a Zacks Rank #1 (Strong Buy) and a positive Earnings ESP (above +1.0%), backtesting demonstrates that the company beats earnings consensus in roughly 70% of instances, providing event-driven traders with a distinct statistical edge ahead of earnings releases.
Zacks Style Scores
To assist factor investors, Zacks supplements its earnings revision model with complementary Style Scores graded from A through F:
- Value Score: Analyzes classic multiples including forward P/E, PEG ratio, Price/Sales, Price/Book, and enterprise-value-to-EBITDA (EV/EBITDA).
- Growth Score: Evaluates historical and projected sales growth, cash flow expansion, and return on equity (ROE).
- Momentum Score: Tracks relative price strength, volume spikes, and technical breakout patterns.
- VGM Composite Score: A weighted master grade combining Value, Growth, and Momentum to identify all-around market leaders.
Independent Research vs. Wall Street Sell-Side Research
The fundamental distinction between independent research providers like Zacks and traditional Wall Street investment banks lies in their commercial business model and organizational incentives.
| Operational Dimension | Zacks Investment Research | Traditional Wall Street Sell-Side (IBs) |
|---|---|---|
| Primary Revenue Source | Data subscriptions, institutional software licensing, retail memberships | Underwriting fees, M&A advisory, IPO allocations, prime brokerage |
| Potential Conflict of Interest | None; zero investment banking or securities underwriting business | High; incentive to avoid offending corporate management seeking advisory deals |
| Rating Distribution | Forced bell curve (5% Rank #1, 5% Rank #5) | Heavily skewed toward “Buy” ratings (>50% Buy, <5% Sell historically) |
| Methodology | Purely quantitative, programmatic, algorithmic | Discretionary, subjective analyst opinion |
| Update Frequency | Recalculated daily based on data feeds | Updated sporadically when analysts publish written research notes |
Practical Applications for Traders and Asset Managers
- Systematic Long-Short Factor Portfolios: Quantitative hedge funds deploy market-neutral equity strategies by systematically taking long positions in top-decile Rank #1 stocks while shorting bottom-decile Rank #5 equities, harvesting the revision spread while hedging out broad market beta.
- Earnings Pre-Announcement Trading: Discretionary swing traders screen for stocks holding a Zacks Rank #1 combined with a positive Earnings ESP greater than 2.0% within five days of quarterly earnings releases to capture the immediate gap-up reaction and subsequent PEAD drift.
- Portfolio Cleansing and Risk Management: Long-only institutional managers mandate that any portfolio holding downgraded to a Zacks Rank #4 or #5 undergo an immediate risk review or automatic divestment, shielding fund assets from severe negative earnings revisions and structural margin compression.
Frequently Asked Questions
What does a Zacks Rank #1 mean for an equity investor?
A Zacks Rank #1 represents a “Strong Buy” recommendation assigned to only the top 5% of covered companies (approximately 220 stocks daily). It indicates that the firm is experiencing aggressive, unanimous upward earnings estimate revisions by covering Wall Street analysts, giving it the highest statistical probability of outperforming the broader market over the subsequent 1 to 3 months.
How does the Earnings ESP metric work?
Earnings ESP (Expected Surprise Prediction) compares the most recent earnings estimates submitted by analysts with the broader consensus figure. If the most recent estimates are higher than the consensus, the ESP is positive. When combined with a Zacks Rank of #1, #2, or #3, a positive ESP accurately predicts a positive quarterly earnings surprise in approximately 70% of historical instances.
Can the Zacks Rank be used as a long-term buy-and-hold indicator?
The Zacks Rank is specifically engineered as a short-to-medium term timing model (typically 1 to 3 months) rather than a multi-year buy-and-hold metric. Because earnings estimate revisions update continuously, a stock’s rank fluctuates based on incoming broker data. Long-term investors typically combine the Zacks Rank for entry timing with Zacks Style Scores (such as Value and Growth) for multi-year holding periods.
Ready to trade forex?
Open a free demo account with a regulated broker. Practice with virtual funds before risking real money.