Zone of Support
A zone of support is a horizontal price range or band on a financial chart where concentrated buying interest historically halts downward price momentum, serving as a dynamic floor where demand overwhelms supply.
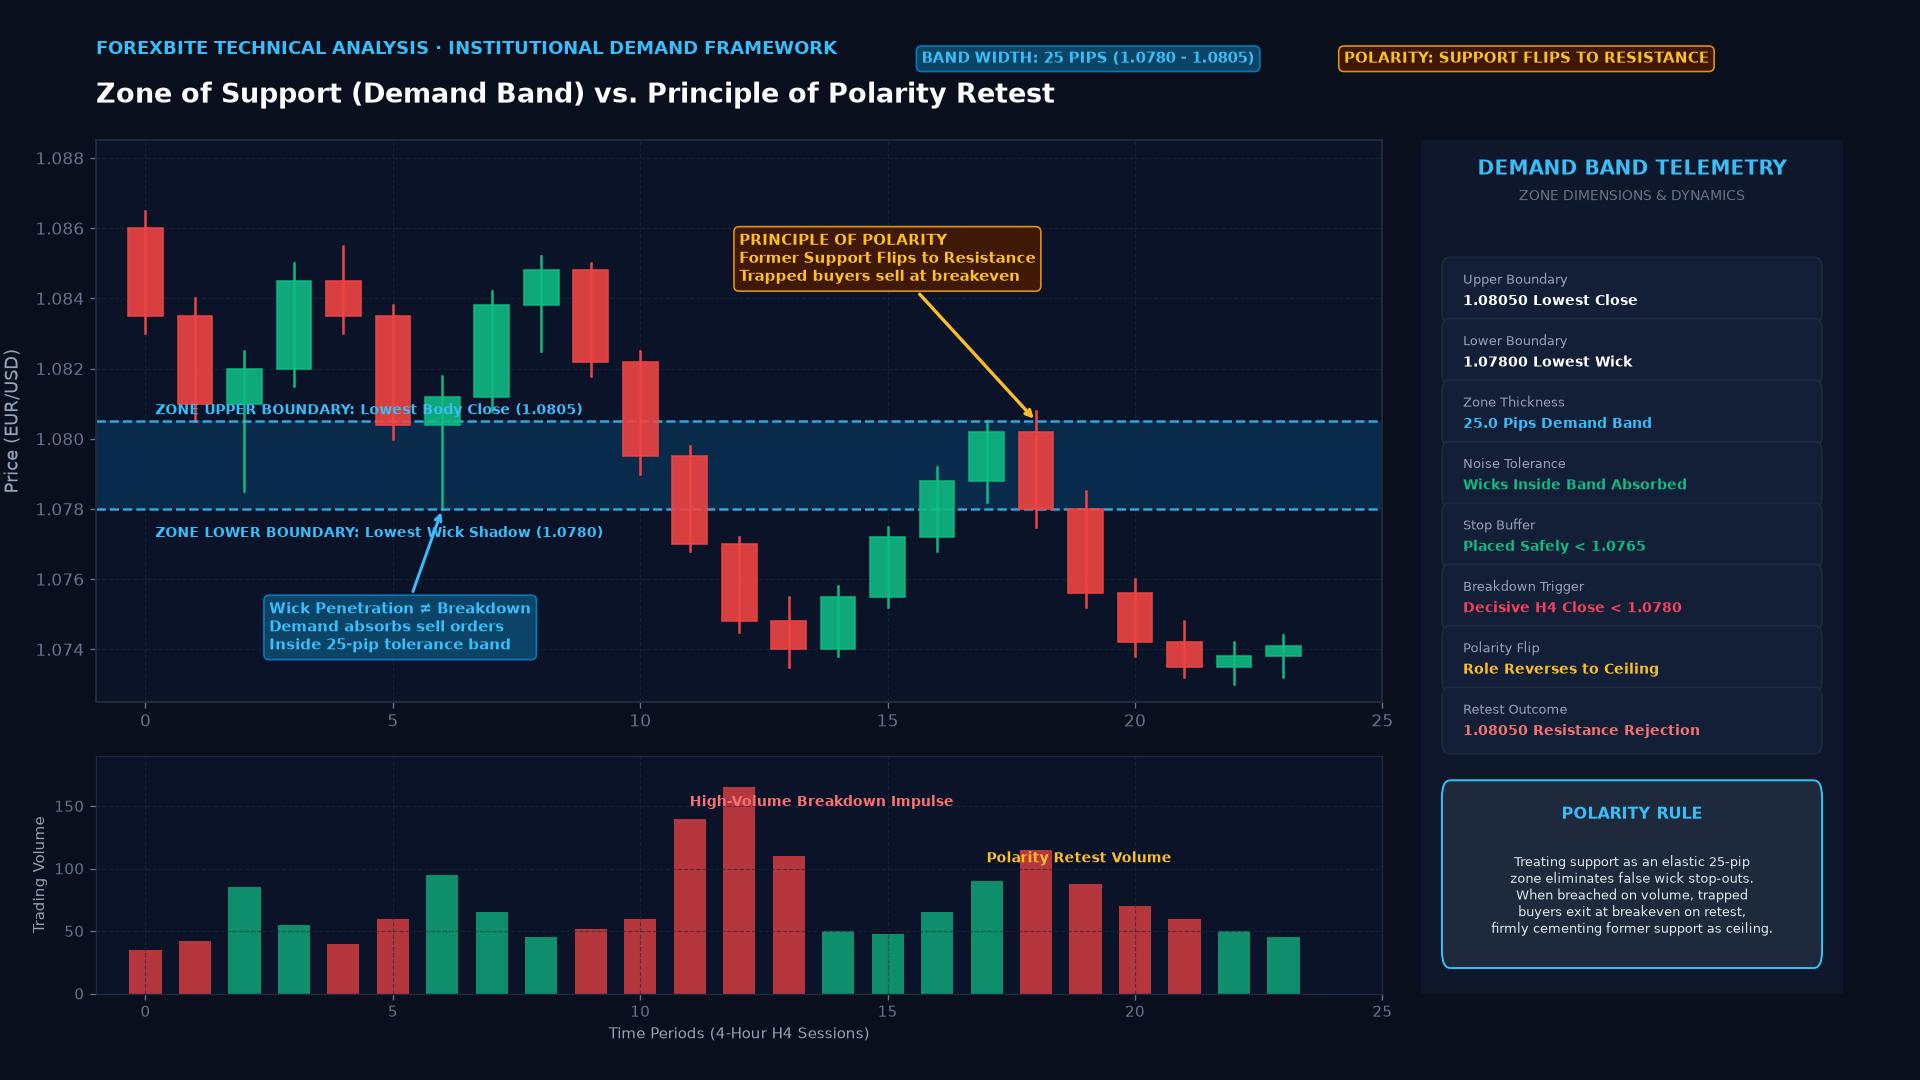
In technical analysis, a zone of support is a horizontal price band on a chart where buying pressure historically matches and overcomes selling pressure, preventing an exchange rate from falling further. While novice traders often draw support as an exact, razor-thin single price line, institutional traders recognize that market liquidity is distributed across a price band—a “zone”—rather than at a single exact decimal point.
Understanding support as a zone rather than a rigid line prevents traders from being prematurely stopped out by minor market noise, bid-ask spread fluctuations, and institutional liquidity sweeps.
Single Support Line vs. Zone of Support
Treating support as an exact line introduces major analytical flaws in modern electronic markets:
| Perspective | Single Support Line Approach | Zone of Support Approach |
|---|---|---|
| Chart Representation | Single horizontal line (e.g., exactly at 1.0800) | Shaded horizontal rectangle (e.g., spanning 1.0780 to 1.0805) |
| Noise Sensitivity | Highly vulnerable; an 8-pip wick penetration is misidentified as a broken breakout | Robust; wick extensions inside the band are recognized as routine tests of liquidity |
| Stop-Loss Placement | Placed 1 to 2 pips beneath the line, frequently triggering stop hunts | Placed safely beyond the entire boundary buffer, protecting trades from volatility |
| Institutional Reality | Unrealistic; massive institutional orders cannot be filled at a single price tick | Accurately reflects how large order books absorb inventory across multiple price tiers |
How to Construct an Objective Zone of Support
To draw an accurate, institutionally relevant zone of support on a currency chart:
- Identify the Key Reaction Lows: Locate a major structural swing low where price previously reversed with notable momentum.
- Establish the Lower Boundary: Anchor the bottom of the zone at the lowest extended wick shadow among the testing candles.
- Establish the Upper Boundary: Anchor the top of the zone at the lowest candle body close within that cluster.
- The Resulting Band: The shaded area between the lowest close and lowest wick creates an objective demand buffer (typically 15 to 30 pips wide on a 4-hour or daily chart).
The Microstructure: Why Support Zones Work
Support zones hold because of the order mechanics of market participants:
- Resting Limit Buy Orders: Large commercial banks, sovereign funds, and algorithmic market makers place dense clusters of limit buy orders inside the zone to accumulate inventory at favorable prices.
- Short-Seller Profit Taking: Traders who shorted the currency pair at higher prices set their buy-to-cover take-profit targets right at the support zone, creating a massive influx of buy-side demand.
- Breakout Traps: As price dips into the upper boundary of the zone, aggressive retail sellers attempt to short the “breakout,” providing the exact opposite liquidity smart money needs to absorb and drive the market higher.
The Principle of Polarity: When Support Flips to Resistance
A fundamental axiom in technical analysis is the Principle of Polarity: once a zone of support is decisively breached on high volume and closing candles, its psychological and structural role reverses, transforming it into a future zone of resistance.
When support breaks:
- Traders who bought inside the zone are trapped in deep floating drawdowns.
- On the subsequent corrective pullback (retest) back up to the zone, those trapped buyers rush to sell at breakeven to escape without loss.
- Fresh breakout sellers add new short positions at the retest, firmly turning the former floor into a formidable ceiling.
Practical Example: Trading a Support Zone Rejection on EUR/USD
Consider EUR/USD pulling back during an established medium-term uptrend:
- Zone Identification: On the 4-hour chart, the trader identifies a historical demand zone between 1.0780 (wick lows) and 1.0805 (candle bodies).
- The Test: During the early European session, sellers push EUR/USD down to 1.0788. Price penetrates the upper boundary of the zone, but fails to close below the lower boundary.
- The Reversal Signal: The 4-hour candle closes as a bullish rejection hammer, printing a long lower wick that absorbs liquidity inside the zone before closing strongly at 1.0815.
- Execution Parameters:
- Entry: Long at 1.0820 on the break of the hammer candle’s high.
- Stop-Loss: Placed 15 pips beneath the bottom edge of the zone at 1.0765 (risking 55 pips).
- Take-Profit: Targeted at the major swing resistance at 1.0985 (targeting 165 pips).
- Outcome: The support zone holds firm, yielding a 3:1 reward-to-risk trade without threatening the trader’s defensive stop-loss.
Key Takeaways
- Price Bands, Not Lines: Support is an area or band of buying liquidity, not an exact single decimal price tick.
- Wick-to-Body Anchoring: Construct zones spanning from the lowest candlestick body close to the lowest extended wick shadow.
- Stop-Hunt Defense: Treating support as a zone provides proper perspective, preventing false alarms on temporary intraday wick sweeps.
- Principle of Polarity: When a support zone is decisively broken, it flips into a future resistance zone upon subsequent retests.
- Confluence Confirmation: The highest-probability support trades combine zone bounces with bullish candlestick price action and momentum oscillator oversold signals.
Frequently Asked Questions
How wide should a zone of support be in forex?
The width depends on the timeframe and currency pair. On a 1-hour or 4-hour chart for major pairs like EUR/USD or USD/JPY, a support zone is typically 15 to 30 pips wide. On daily charts or volatile pairs like GBP/JPY, zones often span 40 to 60 pips.
How many times can a support zone be tested before it breaks?
In trading folklore, some believe that more tests make a support level stronger. In modern institutional reality, the opposite is true: each test absorbs resting buy orders. By the third or fourth test, buy liquidity is depleted, dramatically increasing the probability that the zone will shatter into a sharp downward breakout.
What constitutes a true break of a support zone?
A true break occurs when a higher-timeframe candlestick (such as a 4-hour or daily bar) decisively closes entirely below the lowest boundary of the zone, preferably accompanied by elevated volume and followed by a failed retest.
Ready to trade forex?
Open a free demo account with a regulated broker. Practice with virtual funds before risking real money.