Support
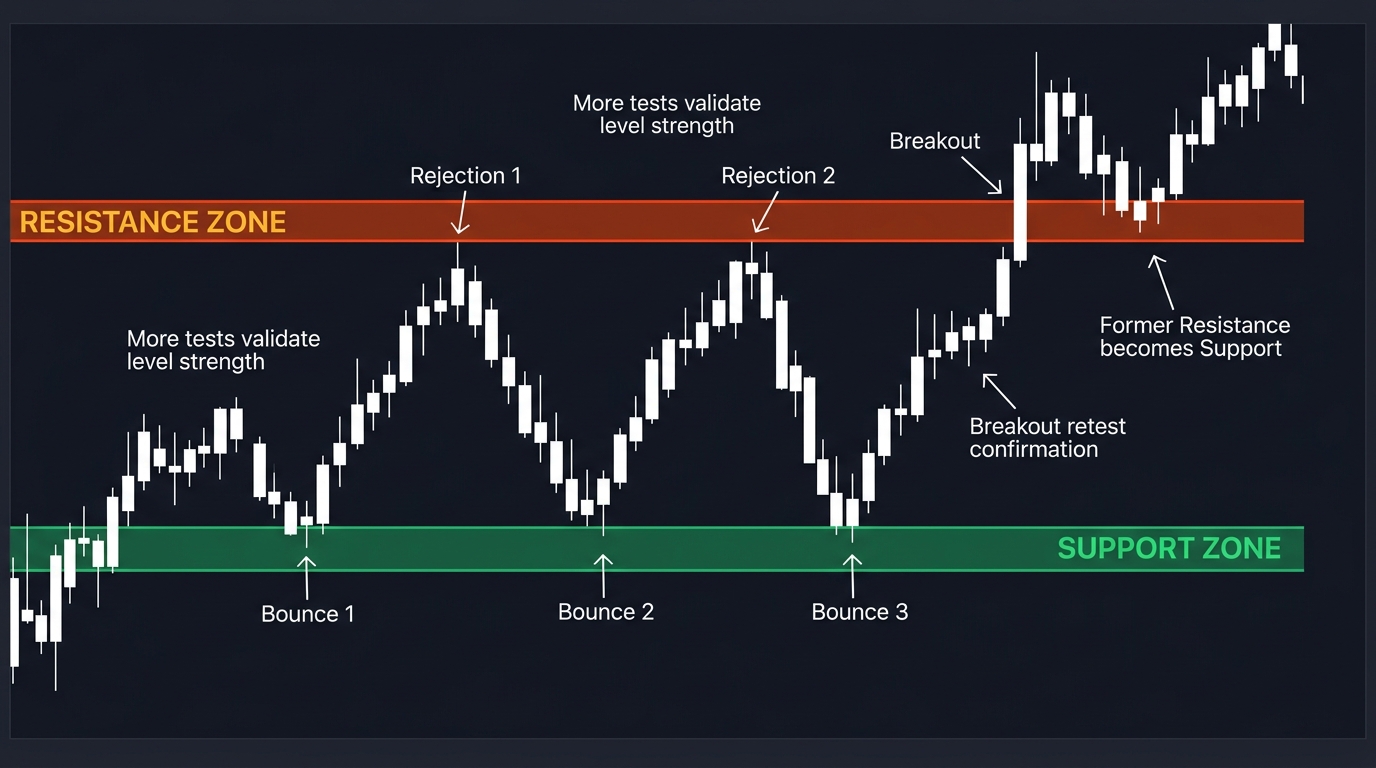
Support is a price level or zone where buying pressure has historically been sufficient to prevent price from falling further. It represents an area where buyers consistently outnumber sellers, creating a floor that price struggles to break through. When support is broken convincingly, it often transforms into resistance — a key concept called 'role reversal' that forms the basis of many technical analysis entry strategies.
Why Support Levels Form
Support levels form at the price points where buyers previously stepped in aggressively enough to halt a decline. The psychological mechanism is the same as resistance, but in reverse.
Imagine EUR/USD declines from 1.1000 to 1.0800, then bounces back to 1.0950. Traders who sold at 1.0800 (bearish positions) are sitting in profits. When price declines again toward 1.0800, those short-sellers take profits — they buy to close their positions. This surge of buying at 1.0800 creates support.
Simultaneously, traders who were watching the original bounce from 1.0800 and missed it are waiting for a second chance to buy at the same level. Their waiting limit buy orders stack up at 1.0800. When price returns, their buying provides additional support.
This self-reinforcing process is why previously tested lows often hold again: the collective memory of buyers and the concentrated limit orders create an effective floor.
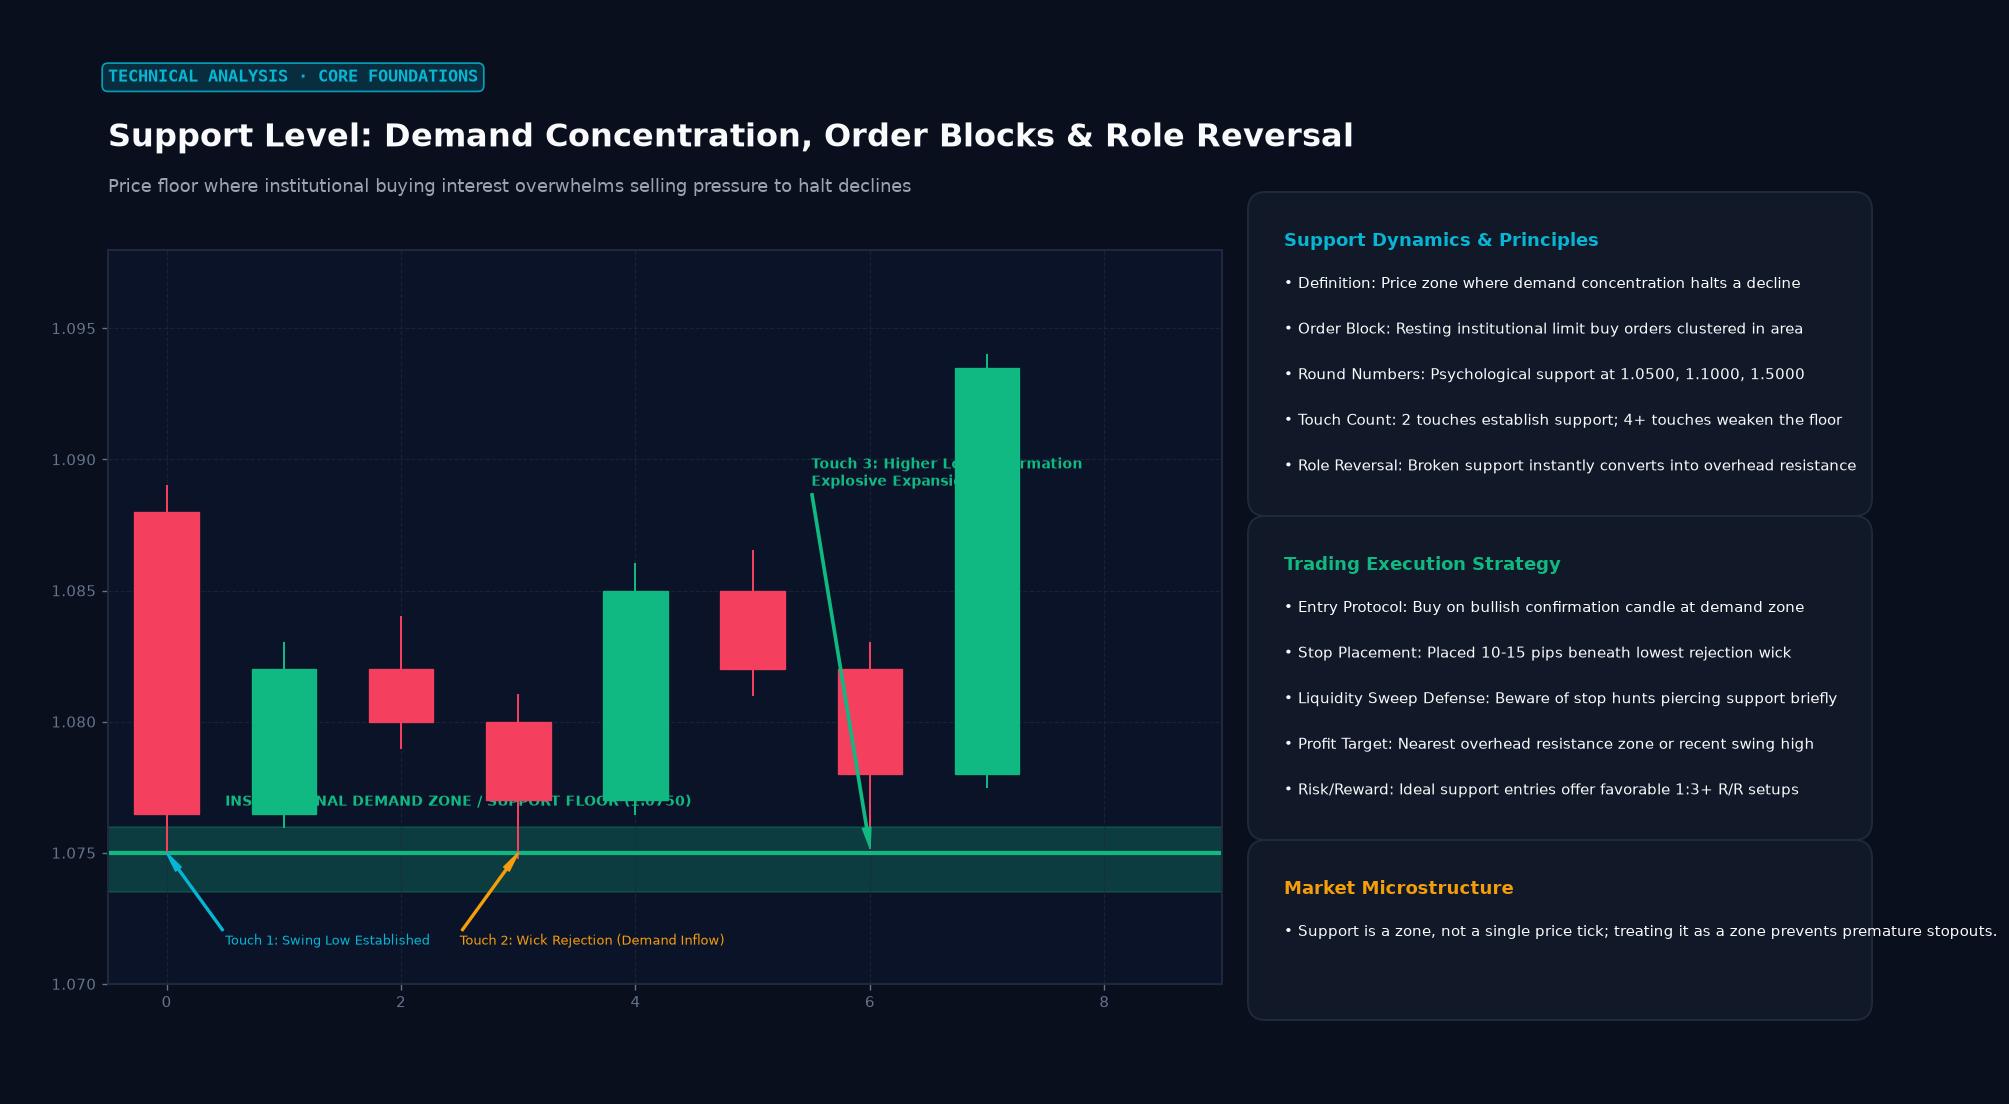 Figure: Price floor where institutional buying interest overwhelms selling pressure to halt declines
Types of Support
Horizontal support: Flat price zones that have held on multiple prior downward tests. The most reliable type, particularly where prior swing lows align. Round numbers (1.0800, 1.0000, 145.00 on USD/JPY) attract additional order concentration due to psychological significance.
Dynamic support (rising trend lines): In an uptrend, the rising series of higher lows forms an ascending trend line that acts as dynamic support. Price pulls back to the trend line and finds buyers. The support rises progressively over time.
Moving average support: In an uptrend, the 20 EMA and 50 SMA often act as dynamic support. Price pulls back to the rising moving average, forms a bullish reversal candle, and continues higher. This is one of the most widely traded setups in all of technical analysis.
Fibonacci support: Fibonacci retracement levels (38.2%, 50%, 61.8%) from a prior swing low to high serve as support on corrections within an uptrend. The 61.8% level (the “golden ratio”) is the most significant.
Previous resistance flipped to support: After a price breaks above a horizontal resistance level, that level becomes support on subsequent pullbacks. Traders who had been waiting for a breakout and missed the initial move now buy the pullback to the former resistance, creating demand at that level. This role reversal is highly reliable.
Trading Support
Long entry at support:
- Identify a clear support level with at least two confirmed prior touches
- Wait for price to decline to the support zone
- Look for a confirming bullish reversal candlestick (hammer, bullish engulfing, morning star, pin bar)
- Enter long on the close of the confirming candle, stop just below the support zone (5-15 pip buffer)
- Target: next resistance level above, or a minimum 1:2 risk-reward multiple of your stop distance
The zone concept: Support is rarely a single price line — it’s a zone spanning 10-30 pips on daily charts. Price often briefly dips below the “support level” before reversing. Setting stops exactly at the support price results in premature stop-outs. Set the stop a meaningful distance below the zone — where, if reached, the level has genuinely broken.
Support and the Broader Market Structure
Support analysis doesn’t exist in isolation. Context matters enormously:
Trend context: Buying at support within an uptrend (the primary trend) is significantly higher probability than buying at support during a downtrend. In a downtrend, what appears as support is often just a temporary pause before the decline continues.
Volume (or tick volume in forex): Strong bounces from support accompanied by high volume confirm aggressive buyer presence. Weak, low-volume bounces from support are more likely to fail.
Age of the level: A support level that’s been respected for six months carries more weight than one from two weeks ago. Longer-standing levels have more concentrated order memory around them.
Key Takeaways
- Support forms from concentrated buyer activity at price levels where the market previously turned higher
- Types: horizontal (most reliable), dynamic (trend lines, moving averages), Fibonacci, and flipped resistance
- Trade by buying at support after a bullish reversal candlestick signal; stop below the zone with a buffer
- Support in an uptrend (trend-following) is higher probability than support in a downtrend (counter-trend)
- Role reversal (former resistance becoming support after a breakout) is among the most reliable technical patterns
FAQ
Is a support level stronger the more times it’s tested? Initially yes — more tests reinforce market memory. But every test also consumes some of the buying supply (buyers who were waiting at that level have now used their orders). After many tests, remaining buy orders become sparse. This is why heavily tested support levels eventually break — the supply of buyers at that level is depleted.
Should I always buy at support? No. Support is a tool, not a rule. A support level should align with: the direction of the higher-timeframe trend, a clear bullish reversal signal on the entry timeframe, and a favorable risk-reward ratio to the next resistance level. Blindly buying every support test, regardless of trend context, is a consistently losing approach.
Ready to trade forex?
Open a free demo account with a regulated broker. Practice with virtual funds before risking real money.