Employment Indicators and Their Impact on Forex
How to trade employment data including Non-Farm Payrolls, unemployment rate, and jobless claims. Understand why labor market data moves forex markets and how to interpret the numbers correctly.
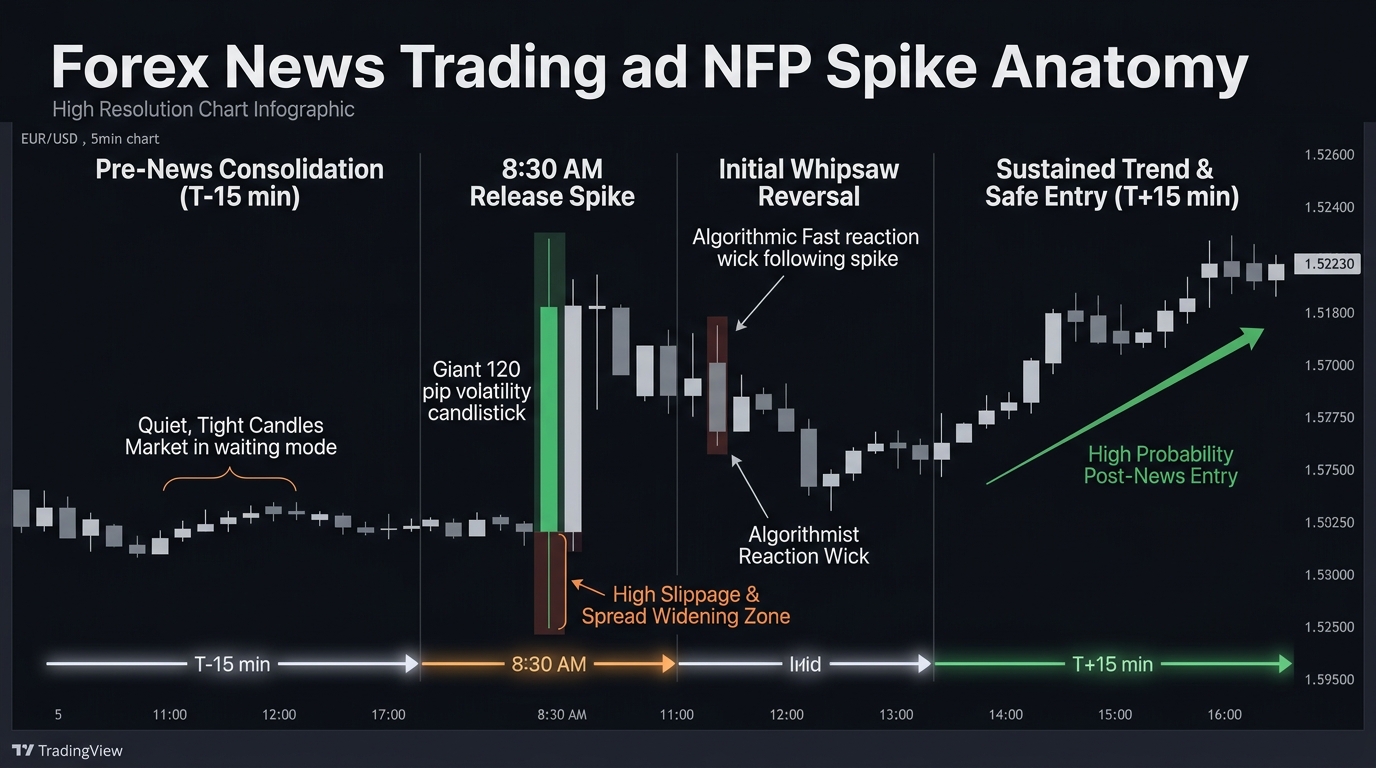
Employment data is released every month across all major economies, and it consistently produces some of the largest short-term currency moves of any scheduled economic event. The US Non-Farm Payrolls report, released on the first Friday of each month, regularly moves EUR/USD, GBP/USD, and USD/JPY by 50 to 150 pips within the first few minutes of publication.
Understanding why employment data matters, what each indicator actually measures, and how markets typically react helps you manage risk around these events and potentially capitalize on them.
Why Employment Data Drives Currencies
Employment indicators matter to forex markets for two interconnected reasons.
First, they are a direct measure of economic health. A growing economy with rising employment means increasing consumer spending, business investment, and tax revenues. These conditions support currency strength because they attract foreign capital seeking returns in a healthy economy.
Second, and more immediately relevant to forex traders, employment data influences central bank interest rate decisions. Most major central banks (especially the US Federal Reserve with its dual mandate) watch labor market conditions closely when deciding whether to raise, hold, or cut rates. Strong employment data supports a hawkish stance; weak data supports dovish policy. Rate expectations move currencies more quickly than almost any other variable.
The Unemployment Rate
The unemployment rate is the most widely reported employment figure. It is calculated by dividing the number of unemployed persons actively seeking work by the total labor force (employed + actively seeking employment).
Key points about unemployment rate interpretation:
It’s a lagging indicator. Large employers don’t immediately lay off workers at the first sign of an economic slowdown. They cut hours, reduce overtime, and freeze hiring first. Only when conditions deteriorate persistently do mass layoffs follow. This means the unemployment rate typically peaks months after the economy has already bottomed.
Similarly, employers are reluctant to hire aggressively at the first signs of recovery. They increase hours for existing workers first. The unemployment rate can remain elevated long after the broader economy has begun improving.
Low unemployment is not always bullish. An unemployment rate near historic lows can actually become a concern for central banks because it suggests wage inflation pressures. If workers are scarce, wages rise. Rising wages can feed into broader price inflation, prompting rate hikes that may be destabilizing if the economy is already slowing.
The participation rate matters. If the unemployment rate falls because discouraged workers stop looking for jobs and leave the labor force, that’s not real improvement. Analysts watch the labor force participation rate alongside the headline unemployment number to assess whether the drop in unemployment reflects genuine strength or a shrinking workforce.
Non-Farm Payrolls (NFP)
The Non-Farm Payrolls (NFP) report is the single most anticipated monthly economic release for USD traders. Published by the US Bureau of Labor Statistics alongside the unemployment report (always on the first Friday of the month at 08:30 Eastern Time), it shows the net change in employment excluding the agricultural sector.
Why non-farm? Agricultural employment is highly seasonal and would distort month-to-month comparisons. Excluding it produces a cleaner signal about the underlying labor market trend.
What the NFP measures: The report surveys business payrolls across manufacturing, services, government, and retail to count how many jobs were added or lost in the previous month. A positive number means the economy added jobs; negative means jobs were lost.
How markets interpret the number: Markets compare the actual figure against the consensus forecast. A print significantly above forecast typically produces a USD rally as expectations for rate hikes increase. A significant miss tends to weaken USD as rate cut probabilities rise.
The wage component is increasingly important. Since the 2021-2022 inflation cycle, markets pay close attention to the Average Hourly Earnings figure released alongside NFP. Rising wages feed into service sector inflation, which the Fed treats as stickier and harder to control than goods price inflation.
Revisions: The NFP report is frequently revised in subsequent months. A strong initial print can be revised lower. Traders who chase the initial spike sometimes get caught when the revision tells a different story.
Weekly Jobless Claims
Initial Jobless Claims is a weekly indicator released every Thursday that counts the number of people who filed for unemployment benefits for the first time in the prior week. It is a leading indicator: it tends to deteriorate before the monthly unemployment rate does.
When initial claims trend higher over several consecutive weeks, it signals rising layoffs and potential labor market deterioration. When claims trend lower, the labor market is strengthening.
The figure is reported in absolute numbers (typically ranging from 150,000 to 300,000+ weekly in the US). Markets focus more on the trend direction than any single week’s reading, since individual weeks can be distorted by holidays, seasonal patterns, or one-time events.
Continuing Claims shows the total number of people receiving unemployment benefits (not just new filers). This gives a picture of how long the average unemployed person is taking to find new work. Rising continuing claims even when initial claims stabilize suggests worsening conditions.
Average Weekly Hours and Earnings
Two secondary employment indicators that often foreshadow trends in the headline numbers:
Average Weekly Hours measures how many hours the average worker in manufacturing is working per week. Employers tend to cut hours before they cut headcount, so a declining average workweek often precedes rising unemployment. Conversely, rising hours indicate that employers are approaching the point where they’ll need to hire more workers.
Average Hourly Earnings measures wage growth. For central bank policy watchers, this figure matters significantly because wage growth above productivity growth is inflationary. If workers earn 5% more but produce 2% more, the cost of goods and services must rise to cover the difference.
Trading Around Employment Releases
The key practical principles for managing positions around employment data:
Know the release time and date. NFP is always the first Friday of the month at 08:30 Eastern Time. Other countries release employment data on varying schedules — track them in the economic calendar.
Size down before the release. Spreads widen dramatically in the minutes before and after NFP. Slippage on stop orders can be severe. If you have existing positions in USD pairs, consider reducing size or tightening stops ahead of the release.
The initial reaction is not always the sustained direction. Algorithmic trading produces the first 50-100 pip move in seconds. This initial spike is frequently partially reversed as human traders process the full report context, including revisions and the wage data. Some traders prefer to wait 5-10 minutes for the volatility to settle before entering.
Compare actual, forecast, and previous together. A number above forecast is bullish for USD in isolation. But if the previous month’s number was also revised significantly lower in the same report, the net picture may be less positive than the headline suggests.
Key Takeaways
- Employment data drives currencies because it signals economic health and influences central bank rate decisions.
- The unemployment rate is a lagging indicator that moves after the economy has already shifted.
- Non-Farm Payrolls is the most market-moving US economic release, published the first Friday of each month.
- The surprise factor (actual vs. forecast) determines the direction of the market reaction.
- Average Hourly Earnings has become increasingly important alongside the headline payrolls number.
- Weekly Jobless Claims is a useful leading indicator for tracking labor market trends between monthly reports.
Continue this module: Inflation Indicators | Interest Rates and Forex

Ready to Practice This Strategy?
Test what you learned on a free, risk-free demo account before risking real money.