Chart Stop-Loss: How to Place Stops Based on Market Structure
A chart stop-loss is placed at a technically significant level, not at an arbitrary pip distance. Learn the three structure-based stop methods, how to avoid the most common placement mistake, and why chart stops outperform fixed stops.
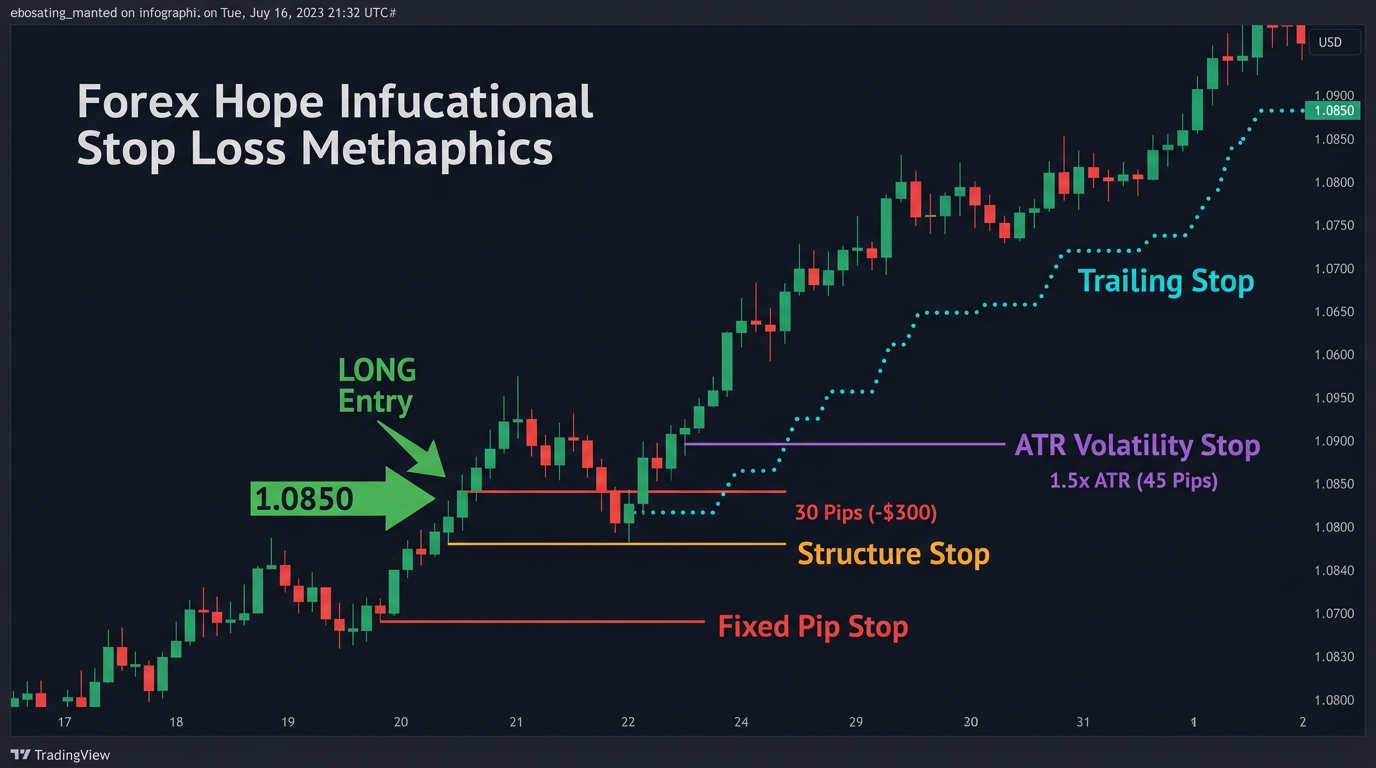
Where you place your stop-loss is not a secondary decision — it’s as important as where you enter. A stop placed too tightly will be hit by normal price noise before the trade has a chance to play out. A stop placed too loosely protects capital but makes the trade unprofitable (the risk-reward ratio collapses).
The chart stop-loss method solves this by tying the stop to a specific price level where the trade thesis becomes objectively invalid — not to a subjective pip amount.
What Is a Chart Stop-Loss?
A chart stop-loss is a stop placed beyond a technically significant level on the chart: a support zone, a resistance zone, a swing high or low, a trendline, or a moving average. When price reaches that level, the original trade setup is no longer valid — and the stop closes the position.
This contrasts with:
- Equity stop: Closes when the dollar loss reaches a defined amount (e.g., close when down $100)
- Fixed-pip stop: Closes when price moves a set number of pips from entry (e.g., 30 pips in every case)
- Volatility stop: Closes at a multiple of ATR from entry (adapts to market conditions)
Chart stops are the most precise because they are anchored to actual market structure rather than arbitrary numbers.
Method 1: Stop Beyond a Swing High / Swing Low
The most fundamental chart stop placement.
For a long trade: Place the stop below the most recent swing low before entry. This is the last level where price clearly found support before moving higher. If price returns below that level, the upside structure is broken and the long thesis is invalid.
For a short trade: Place the stop above the most recent swing high before entry. If price reclaims that high, the downtrend is interrupted.
Example (long):
- You buy EUR/USD at 1.0850 after a bullish engulfing at support
- The most recent swing low is at 1.0810
- Stop-loss: 1.0800 (10-pip buffer below the swing low)
- Rationale: If EUR/USD falls below 1.0800, the support structure has failed — the trade is wrong
The 10-pip buffer is important. Place the stop beyond the swing low by a small margin to avoid being hit by a brief wick that touches the level and reverses. The buffer depends on the pair and timeframe:
| Timeframe | Suggested Buffer |
|---|---|
| 15M | 5–8 pips |
| 1H | 10–15 pips |
| 4H | 15–25 pips |
| Daily | 25–40 pips |
Method 2: Stop Beyond a Support / Resistance Zone
When you’re entering at a defined support or resistance zone, the stop goes on the other side of that zone — not at the edge, not at the midpoint, but beyond the zone.
For a long trade at support:
- Identify the support zone (area between lower wick extreme and candle body low)
- Stop goes below the lower boundary of the zone, plus buffer
For a short trade at resistance:
- Identify the resistance zone (area between upper wick extreme and candle body high)
- Stop goes above the upper boundary of the zone, plus buffer
Why beyond the zone, not at the edge? Price frequently probes the zone — dipping slightly below support or spiking briefly above resistance — before reversing. A stop at the zone edge will be hit by these probes. A stop beyond the zone is only hit if the level genuinely fails.
Method 3: Stop Beyond a Moving Average
In trend-following strategies where you’re entering on a pullback to a key moving average (e.g., the 50 EMA or 200 SMA), the stop goes on the other side of the MA.
Long trade (pullback to 50 EMA in uptrend):
- Price pulls back to the 50 EMA and forms a rejection candle
- Entry at the next candle open
- Stop: 15–25 pips below the 50 EMA at time of entry
- Rationale: If price closes below the 50 EMA, the MA is no longer providing support — the trade is wrong
This stop method needs recalibration for dynamic MAs: as the MA moves, the stop distance does too. Most traders set the MA stop at a fixed distance below the MA value at the time of entry, not a floating distance.
The Most Common Stop-Loss Mistake
Placing stops at the exact swing low/high or S/R level — not beyond it.
This is the precise point where the maximum number of retail stop-loss orders are clustered. Institutional traders and algorithms know this. The well-documented phenomenon of “stop hunting” — where price temporarily breaches a key level before reversing — is partly explained by the concentration of stop orders at obvious levels.
The fix: always place stops a meaningful distance beyond the level, not at it.
Equally common: placing stops too close to the entry out of fear of losing too much. If a trade requires a 50-pip stop based on proper structure analysis but you only place a 20-pip stop because “50 pips is too much to risk,” you haven’t reduced your risk — you’ve increased the probability of being stopped out on a normal retest and then watching price move in your original direction without you.
If a 50-pip stop requires more risk than your account can support at 1%, reduce your position size — don’t shrink the stop.
Comparing Stop Methods
| Method | Adaptability | Precision | Best For |
|---|---|---|---|
| Chart (structure) | Medium | High | Most swing and position trades |
| Fixed pip | None | Low | Beginners learning basics |
| ATR-based | High (adapts to volatility) | Medium | Volatile pairs; variable conditions |
| Equity-based | None | Low | Hard account protection limit |
In practice, professional traders often combine methods: a chart stop (structure-based) with a maximum distance cap defined by ATR. If the chart stop would need to be wider than 2× ATR to be placed correctly, it’s a signal the entry point is poor — reconsider the trade.
Stop-Loss and Position Sizing: The Connection
The chart stop distance determines your position size — not the other way around. This is the critical sequencing that most beginners reverse:
Correct sequence:
- Identify the entry price
- Identify the structure-based stop-loss level
- Calculate stop distance in pips
- Use position size calculator → lot size is the output, not the input
Reversed (wrong) sequence:
- Decide you want to trade 1 lot (because the account “should” support it)
- Calculate what the loss would be if you used the correct stop
- Shrink the stop to fit the desired lot size
The wrong sequence consistently produces stops that are too tight for the structure — and consistently loses more money than necessary.
Trailing the Stop After Entry
Once a trade is in profit, chart stops can also be used to trail:
Long trade — trailing method:
- As price makes new higher highs, new higher lows form
- Trail the stop to just below each new significant higher low
- This locks in progressively more profit while letting the trade continue as long as the structure is intact
The trail stops when the price breaks below the most recent higher low — which is the same structural signal that would identify an uptrend as having ended.
Key Takeaways
- A chart stop-loss is placed beyond a technically significant level (swing high/low, S/R zone, moving average) where the trade’s original thesis becomes invalid
- The three chart stop methods: beyond swing high/low (most common), beyond S/R zone, beyond moving average
- Always add a buffer beyond the key level — not at it — to avoid “stop hunting” probes at obvious cluster points
- Buffer size scales with timeframe: 5–8 pips on 15M, 25–40 pips on Daily
- Never shrink the stop to justify a larger lot size; instead, reduce lot size to maintain the correct chart stop distance
- Trail the stop to successive higher lows (long) or lower highs (short) as the trade progresses to lock in profits systematically
Next: Equity Stop-Loss | Volatility Stop-Loss
Tools: Position Size Calculator | ATR Reference: Average True Range

Ready to Practice This Strategy?
Test what you learned on a free, risk-free demo account before risking real money.