Trends in Forex: How to Identify, Classify, and Trade Market Trends
Trend trading is the backbone of most profitable forex strategies. Learn how to identify uptrends, downtrends, and ranges, use Dow Theory principles, and determine trend strength before placing a trade.
“The trend is your friend” is the most repeated phrase in forex trading — and one of the least understood. It’s not just a slogan. It’s a statistical observation: trades taken in the direction of the dominant trend succeed at a measurably higher rate than trades taken against it.
Understanding exactly what a trend is, how to classify it, how to confirm it, and when it’s ending is one of the most valuable skills in technical analysis.
What Is a Market Trend?
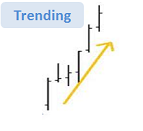
A trend is a sustained directional bias in price movement. Three types exist:
- Uptrend: A series of higher highs (HH) and higher lows (HL)
- Downtrend: A series of lower highs (LH) and lower lows (LL)
- Sideways / Range: Price oscillating within a relatively horizontal band without making new highs or lows
The pattern of highs and lows is the definitive test. Not the moving average slope. Not the RSI level. The actual structure of price swings.
Uptrend structure:
     HH₂
  HH₁   \
   |  HL₂ \
  HL₁     (entry zone)
Each successive high is higher than the last. Each successive low is higher than the last. As long as this pattern holds, the uptrend is intact.
Dow Theory: The Foundation of Trend Analysis
Charles Dow’s market theory (1900s) remains the bedrock of modern trend analysis. Three principles are directly applicable to forex:
Principle 1: Markets discount everything All available information — economic data, geopolitical events, market sentiment — is already reflected in the current price. This is why you analyze price itself, not just the news.
Principle 2: Trends have three phases
| Phase | Uptrend | Downtrend |
|---|---|---|
| Accumulation / Distribution | Informed buyers accumulate while retail sellers remain bearish | Informed sellers distribute while retail buyers remain bullish |
| Trending phase | Majority of participants join the trend; price advances significantly | Most participants join the downtrend; significant price decline |
| Speculation / Panic | Late-arriving traders push to extremes; trend becomes overextended | Panic selling / capitulation; trend nearing exhaustion |
Identifying which phase the market is in helps calibrate risk. Entering during the speculation phase (parabolic moves at extreme extensions) carries significantly higher reversal risk.
Principle 3: Trends remain intact until proven otherwise Until price breaks the pattern of higher highs and higher lows (in an uptrend), the trend is still valid. A single pullback — even a sharp one — does not end a trend unless it breaks the most recent higher low.
The Three Degrees of Trend
Trends exist simultaneously on multiple timeframes. A currency pair can be in a long-term uptrend, a medium-term downtrend within that uptrend (a correction), and a short-term uptrend within the correction.
| Degree | Timeframe | Duration |
|---|---|---|
| Primary trend | Weekly, Monthly | Months to years |
| Secondary trend | Daily, 4H | Weeks to months |
| Minor trend | 1H, 4H | Days to weeks |
The principle of alignment: Trades where all three trend degrees align produce the highest probability setups. A long trade on the 1H chart, confirmed by an uptrend on the 4H chart, within a major uptrend on the Daily — this is the strongest possible trend context.
Trades against higher-degree trends carry elevated risk, even when the lower-timeframe signal looks compelling.
How to Confirm a Trend
Identifying a potential trend from highs and lows is the first step. Confirming its strength requires additional validation:
Tool 1: ADX (Average Directional Index) ADX above 25 = measurable trend in place. ADX above 35 = strong trend. Below 20 = no meaningful trend, market is ranging. Always check ADX before applying any trend-following strategy.
Tool 2: Moving Average Direction and Slope A 50 SMA that is clearly sloping upward and being respected by price (price bouncing off it, not slicing through repeatedly) confirms uptrend. A flat 50 SMA in a period of price oscillation signals a range.
Tool 3: Price Structure Consistency Count the last 5 swing highs and lows. Are all highs higher than the previous? Are all lows higher? Consistent structure = strong trend. One higher low violation doesn’t end a trend; two consecutive lower lows do.
Trend vs. Range: The Most Important Distinction
Every trading strategy fails in the wrong market condition. Trend-following strategies fail in ranges. Range-trading strategies fail in trends.
| Indicator | Trending Market | Ranging Market |
|---|---|---|
| ADX | Above 25 | Below 20 |
| Price vs. 200 SMA | Strongly above or below | Oscillating around |
| Bollinger Bands | Expanding | Contracting |
| Moving averages | Clearly sloping | Flat, intertwining |
| Price structure | Consistent HH/HL or LL/LH | Mixed swings, no clear direction |
Before placing any trade, classify the market condition. If ADX is below 20 and price is oscillating between identifiable support and resistance, apply range strategies. If ADX is above 25, price is trending away from the 200 SMA, and structure is clear — apply trend strategies.
When Does a Trend End?
A trend ends when its structural requirements are violated:
Uptrend ending signals:
- Price fails to make a new higher high (first warning)
- Price breaks below the most recent higher low (structural break — first confirmation)
- A new lower low forms below the previous higher low (second confirmation — trend ended)
False trend endings (avoid:
- A single sharp pullback that quickly reverses
- Price touching but not closing below a key higher low
- A spike low caused by news that reverses by the next candle
Wait for a confirmed candle close beyond the structural level before declaring a trend ended.
Practical Trend Trading Framework
Step 1: Identify the primary trend on the daily chart (HH/HL pattern?)
Step 2: Confirm with ADX (above 25?) and 200 SMA direction
Step 3: Note the most recent swing high and swing low — these are your structural reference points
Step 4: Drop to 4H for secondary trend context. Is the 4H trend aligned with the daily?
Step 5: On the 4H chart, look for a pullback to a key moving average or support zone (in an uptrend)
Step 6: Enter when price action at the support zone confirms continuation (rejection candle, bullish engulfing, etc.)
Step 7: Stop-loss goes below the most recent higher low on the 4H chart
Step 8: Take-profit at the next significant resistance level
Key Takeaways
- An uptrend is defined by higher highs and higher lows; a downtrend by lower highs and lower lows. Price structure, not indicators, is the definitive test.
- Dow Theory’s three-phase model (accumulation → trend → speculation) helps identify where in the trend lifecycle you’re entering
- Trends exist on multiple timeframes simultaneously; the highest-probability setups occur when daily, 4H, and 1H trends all align in the same direction
- ADX is the most reliable tool for distinguishing trending markets (ADX >25) from ranging ones (ADX <20) — always check before applying a trend strategy
- A trend ends when the last structural higher low (uptrend) or lower high (downtrend) is clearly broken on a candle close
- The most important habit: classify the market condition (trending vs. ranging) before choosing a strategy
Next: Support and Resistance Levels | Moving Averages
Related dictionary terms: Trend | Swing High | Dow Theory

Ready to Practice This Strategy?
Test what you learned on a free, risk-free demo account before risking real money.