Methods to Establish Support and Resistance in Forex
Support and resistance levels can be identified through multiple methods — swing highs/lows, psychological round numbers, Fibonacci levels, and moving averages. Learn how to find the strongest levels by combining these approaches.
Support and resistance are the building blocks of almost every technical trading strategy. Before you can trade a bounce, a breakout, or a reversal, you need to know where the significant levels are — and more importantly, which ones are genuinely significant versus which ones are arbitrary lines on a chart.
This lesson is the companion to the Support and Resistance Levels lesson, focusing specifically on the methods for identifying levels rather than the concepts themselves.
Method 1: Swing Highs and Swing Lows
Definition: A swing high is a peak where price briefly moved up then reversed lower. A swing low is a trough where price briefly moved down then reversed higher. These are the most fundamental S/R levels because they represent actual points where buyers and sellers have previously clashed.
Rules for identifying significant swings:
- The swing must have at least 2–3 candles declining on each side of the peak (swing high) or rallying on each side of the trough (swing low)
- Minor 1–2 candle reversals are too small to count as swing points
- The larger the swing in absolute pips, the more significant the level
Strength rating:
- Tested multiple times: Very Strong
- Tested once with strong price rejection: Strong
- Tested once with moderate rejection: Moderate
Application: Mark the most recent swing high as resistance and the most recent swing low as support. In trending markets, mark the series of swing lows (uptrend) or swing highs (downtrend) as well — these form the dynamic support/resistance of the trend.
Method 2: Psychological Round Numbers
Definition: Price levels that end in round numbers — specifically 00, 50, and sometimes 20/80.
Examples: 1.0000, 1.0500, 1.1000, 150.00, 0.6500
Why they matter: Traders, institutions, and algorithms place large orders at round numbers. This creates self-reinforcing concentration of orders that makes these levels act as stronger support or resistance than technically derived levels nearby.
Hierarchy of psychological levels:
| Level Type | Example (EUR/USD) | Significance |
|---|---|---|
| Big figures (00) | 1.0800, 1.0900 | Highest — major institutional order concentration |
| Half-figures (50) | 1.0850, 1.0950 | High — secondary institutional reference |
| Quarter-figures (25/75) | 1.0825, 1.0875 | Moderate — widely watched in active pairs |
Practical rule: When a swing high or technical level coincides with a round number (e.g., a swing high at 1.1003 alongside the 1.1000 big figure), the confluence makes the level significantly more significant. Always note nearby round numbers when marking S/R.
Method 3: Fibonacci Retracement Levels
Definition: Horizontal levels drawn at specific Fibonacci ratios (38.2%, 50%, 61.8%, 78.6%) between a significant swing high and swing low.
The key levels:
| Level | Interpretation |
|---|---|
| 23.6% | Shallow retracement; common in very strong trends |
| 38.2% | Minor retracement zone; first test in moderate trends |
| 50% | Mid-point; psychological and frequently respected |
| 61.8% | The “golden ratio” — most widely watched Fibonacci level |
| 78.6% | Deep retracement; last line before trend continuation fails |
How to draw them: Select the most recent significant swing high and swing low. The Fibonacci tool draws horizontal lines at each ratio between the two points.
Best application: In a trending market, after a clear directional move (the impulse), wait for price to pull back. The Fibonacci retracement identifies where that pullback is likely to find support (in an uptrend) before the trend resumes.
The 61.8% level is particularly watched because it’s the most referenced Fibonacci ratio. Institutional algorithms have this level built into their grid systems — its significance is partially self-fulfilling.
For a full Fibonacci guide, see the Fibonacci Retracement lesson.
Method 4: Moving Averages as Dynamic S/R
Definition: Key moving averages act as dynamic (moving) support in uptrends and resistance in downtrends. Unlike the other methods, MA-based S/R levels shift with each candle.
The most significant MAs for S/R:
| MA | Timeframe | Role |
|---|---|---|
| 20 EMA | 1H, 4H | Short-term dynamic S/R in active trends |
| 50 EMA | 4H, Daily | Medium-term S/R bounce zone |
| 50 SMA | 4H, Daily | Institutional reference; very widely watched |
| 200 SMA | Daily | Long-term major S/R; often defines major bull/bear |
How to use: In an uptrend, when price pulls back to a key MA (e.g., 50 SMA daily), watch for a rejection candle. This is a potential long entry. Stop goes below the MA; target is the previous swing high.
Limitation: MA-based S/R only applies in trending conditions. In a ranging market where price oscillates around the MA, it provides no consistent support or resistance function.
Method 5: Pivot Points
Definition: Calculated from the previous period’s high, low, and close to project support and resistance levels for the current period.
The formula:
PP = (High + Low + Close) / 3
R1 = (2 × PP) - Low
S1 = (2 × PP) - High
(Full details in the Pivot Points lesson)
Best application for S/R establishment: Daily pivot levels provide intraday reference points widely used by institutional day traders. S1 and R1 are the most commonly tested levels within a normal trading day.
Combining with swing levels: When a daily S1 or R1 coincides with a recent swing high or low, the confluence of two different methods produces a particularly significant zone.
The Confluence Principle: The Most Important Concept
No single method produces definitive S/R levels. The most reliable support and resistance zones are identified where multiple methods point to the same price area simultaneously.
Confluence scoring:
| Confluence Factors | Level Strength |
|---|---|
| 1 method | Moderate — tradeable but lower conviction |
| 2 methods | Strong — high-probability zone |
| 3 methods | Very Strong — premium trade setup |
| 4+ methods | Exceptional — highest conviction; size up |
Example of exceptional confluence:
- The most recent swing low at 1.0800
- The 61.8% Fibonacci retracement at 1.0795
- The daily 50 SMA at 1.0805
- The big figure psychological level at 1.0800
All four point to the 1.0795–1.0810 zone. When price reaches this zone, you have four independent reasons to expect support. The probability of a bounce is significantly higher than at any single-method level.
How to Mark Levels on Your Chart
Practical workflow:
- Open the daily chart of your pair
- Mark the most recent 3–5 significant swing highs and lows
- Note any round numbers (00, 50) within 15 pips of those levels
- Draw Fibonacci retracement from the most significant recent move
- Add the 50 SMA and 200 SMA
- Note where multiple factors cluster — mark those zones with a rectangle, not a line
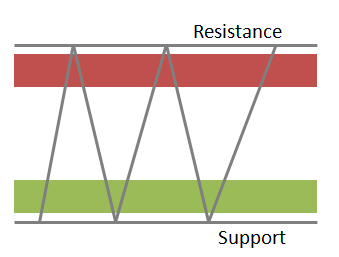
Use zones, not lines: Price rarely turns at an exact pip. A zone of 15–30 pips (wider for the daily chart; narrower for 1H) more accurately represents the area of expected order concentration.
Key Takeaways
- Five methods for identifying S/R: swing highs/lows, psychological round numbers, Fibonacci retracements, moving average bounces, and pivot points
- No single method is sufficient on its own — the confluence of multiple methods pointing to the same zone creates the most reliable levels
- Rate zones by confluence: one method = moderate; two = strong; three or more = high conviction
- Big figures (round numbers ending in 00) are the most widely watched non-technical levels; always note nearby round numbers when marking S/R
- The 61.8% Fibonacci level and the 50 SMA on the daily chart are the most frequently respected individual levels in forex trading
- Mark S/R as zones (rectangles on your chart), not as single precise lines
Related lessons: Support and Resistance Levels | Fibonacci Retracement | Pivot Points

Ready to Practice This Strategy?
Test what you learned on a free, risk-free demo account before risking real money.