Fibonacci Retracement: How to Draw Levels and Trade the Pullback
Fibonacci retracement levels are one of the most widely used tools in forex technical analysis. Learn how to draw them correctly, which levels matter most, and how to combine them with other signals for high-probability entries.
Leonardo Fibonacci documented his number sequence in the 13th century. In 2026, traders are still drawing these ratios on their forex charts, and the levels keep working. Whether this is self-fulfilling prophecy or something deeper in market structure is debated — but the practical reality is that Fibonacci levels attract enough institutional attention to remain relevant.
Used mechanically without context, Fibonacci retracement lines are noise generators. Used intelligently as a confluence filter alongside trend direction, price action, and support/resistance, they can significantly improve entry timing and risk-reward.
The Fibonacci Sequence and Market Ratios
The Fibonacci sequence: 0, 1, 1, 2, 3, 5, 8, 13, 21, 34, 55, 89, 144…
Each number is the sum of the two before it. The ratios that emerge from this sequence appear repeatedly in nature and — traders discovered in the 20th century — in financial market behavior:
- 0.236 (23.6%): Shallowest retracement; shallow pullback in strong trends
- 0.382 (38.2%): Common in strong trends; the pullback the trend wants to see
- 0.500 (50.0%): Not a Fibonacci ratio mathematically, but widely used (half-retracement)
- 0.618 (61.8%): The “Golden Ratio”; the deepest common retracement
- 0.786 (78.6%): Deep retracement; often the last before the trend resumes or breaks
The three most important levels in forex trading: 38.2%, 50%, and 61.8%.
How to Draw Fibonacci Retracement Correctly
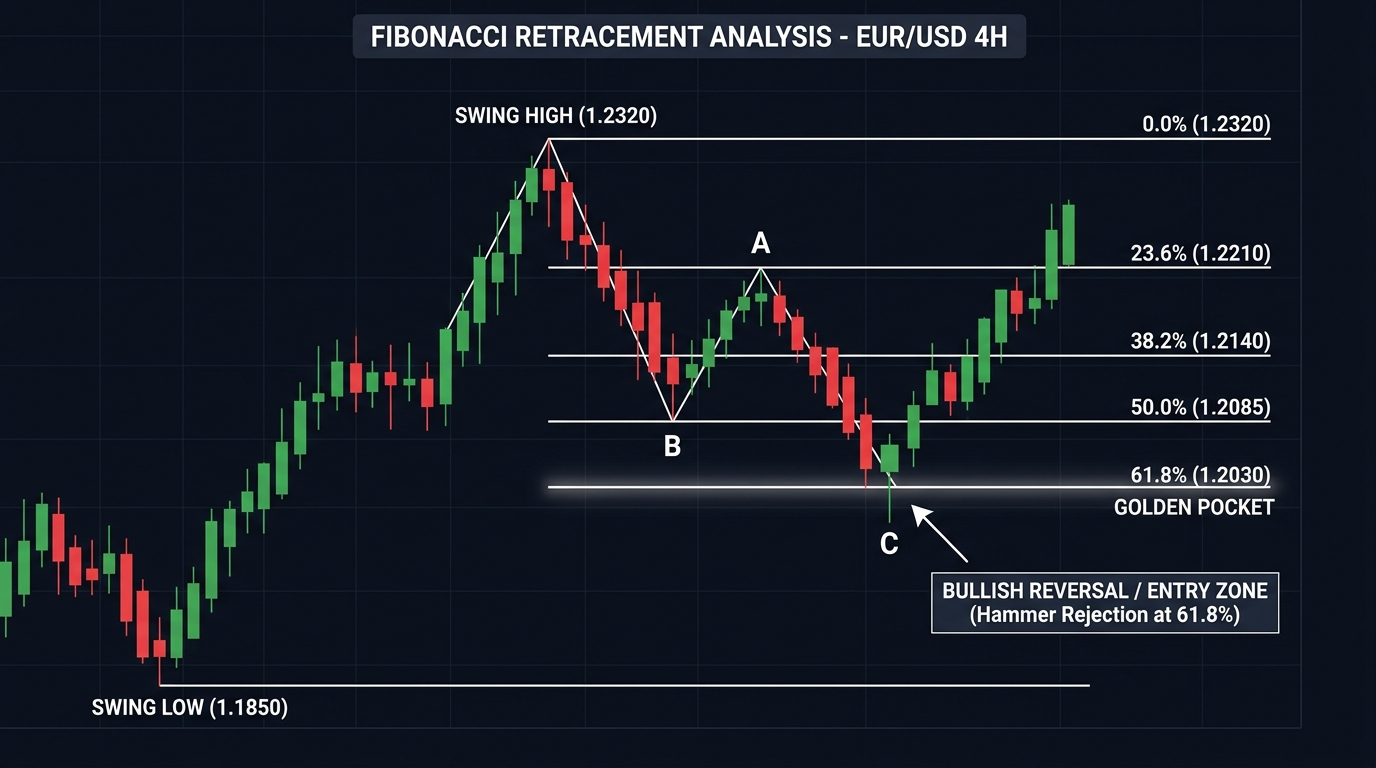
The most common error: drawing Fibonacci from the wrong swing points. This is where incorrect application produces poor results.
Rule for an uptrend:
- Identify a clear, significant swing low (the start of the move)
- Identify the swing high (the end of the move)
- Draw from the swing low to the swing high (bottom to top)
- The retracement levels appear between these two points
Rule for a downtrend:
- Identify the swing high (start of the move)
- Identify the swing low (end of the move)
- Draw from the swing high to the swing low (top to bottom)
- The retracement levels appear between these two points
Critical: Use significant swing points on the appropriate timeframe. A Fibonacci drawn on a 15-minute chart using minor swings produces noise. Fibonacci drawn on the daily chart using major swing highs and lows produces the meaningful levels.
Which Levels Are Most Important
Not all Fibonacci levels are equal. In practice, three zones command the most attention:
| Level | Significance | Market Behavior |
|---|---|---|
| 23.6% | Low | Brief pause in strong momentum; rarely a major decision point |
| 38.2% | Medium-High | Common pullback in strong trends; institutional buy/sell zone |
| 50.0% | High | Psychological half-retracement; heavily watched |
| 61.8% | Very High | The Golden Ratio; deepest common retracement before trend resumes |
| 78.6% | High | Deep retracement; last line before trend invalidation |
If price retraces to 61.8% and holds, the original trend is still likely intact. If it breaks through 78.6%, the swing point is typically reconsidered.
Trading the Fibonacci Retracement: Entry Setups
Setup 1: Trend Continuation (Pullback Entry)
This is the core Fibonacci trade. You identify a trending move, wait for price to pull back to a key Fibonacci level, and enter in the direction of the original trend.
| Step | Action |
|---|---|
| 1. Identify trend | Clear directional move on daily or 4H chart |
| 2. Draw Fibonacci | From the start of the move (swing low) to the most recent high (uptrend) |
| 3. Wait for pullback | Let price retrace toward 38.2%, 50%, or 61.8% |
| 4. Confirm at level | Look for a rejection candlestick (pin bar, engulfing, hammer) at the Fib level |
| 5. Entry | Buy/sell on the close of the confirmation candle |
| 6. Stop-loss | Below the Fibonacci level you traded (for longs) — typically 10–20 pips beyond |
| 7. Take-profit | The swing high (uptrend) or next resistance level |
Setup 2: Fibonacci + Support/Resistance Confluence
When a Fibonacci level coincides with a pre-existing support or resistance zone, the combined signal is significantly stronger.
How to find confluence:
- Draw Fibonacci retracement on the major swing
- Mark existing support/resistance zones from the daily chart
- Look for any Fibonacci level that sits inside a pre-existing S/R zone
- This confluence point is where you focus your attention for entries
A 61.8% Fibonacci level sitting directly on a tested support zone, during an uptrend, with a bullish pin bar rejection — that’s a high-quality entry with three independent factors aligning.
Setup 3: Fibonacci + Moving Average
The 50-day or 200-day SMA often pulls back to a Fibonacci level simultaneously. This creates a dynamic/static confluence:
- Price retracing to 50.0% Fibonacci AND the 50 SMA at the same price level
- Both the Golden Ratio and the 200 SMA at the same level
These combinations reduce false signals because they require two independent tools to agree before entry.
Common Mistakes When Using Fibonacci
Drawing from the wrong swing points: Using minor swings produces meaningless levels. Always use the most significant recent swing that defines the move you’re analyzing.
Trading Fibonacci levels in isolation: A Fibonacci level alone is not an entry signal. It defines a zone of potential interest. The entry trigger must be a price action signal within that zone.
Using every level: Traders who mark all seven or eight Fibonacci levels create charts that look impressive but produce contradictory signals at every price point. Focus on 38.2%, 50%, and 61.8%.
Ignoring the trend: Fibonacci retracement is a trend-continuation tool. Using it to pick reversal tops in strong trends produces frequent losses. The question is “where will this trend resume?” — not “where will it reverse?”
Not accounting for the spread: In live trading, your entry might be at 1.08420 when the Fibonacci shows 1.08400. The zone approach (not a single line) accommodates this naturally.
Fibonacci Extension Levels
Fibonacci levels are also used to project price targets beyond the starting swing high, not just retracement levels within the move. These are called Fibonacci extensions.
The most commonly used extension levels:
- 127.2% — First extension target; price frequently pauses here
- 161.8% — The Golden Ratio extension; the most important projected target
- 261.8% — Second extension; for strong, sustained trends
Extensions are drawn from the same swing points as retracements. If you’re buying at a 61.8% retracement, your primary take-profit is often placed at the 127.2% or 161.8% extension.
Fibonacci on Different Timeframes
| Timeframe | Use Case |
|---|---|
| Weekly/Monthly | Define major multi-month retracement zones; high-significance levels |
| Daily | The primary Fibonacci timeframe for swing traders |
| 4H | Secondary timeframe; use daily Fibonacci as filter |
| 1H | Entry timing only; Fibonacci levels from 4H/Daily take precedence |
Never draw Fibonacci on a 5-minute chart and trade it as a standalone signal. Lower-timeframe Fibonacci levels are only meaningful when they coincide with higher-timeframe structures.
Risk Management
| Parameter | Recommendation |
|---|---|
| Risk per trade | 1% of account |
| Stop-loss | Beyond the Fibonacci level traded (+ buffer for spread and noise) |
| Minimum RR | 1:2; with the swing high as target this is usually achievable |
| Confirmation required | At least one price action signal in the zone |
Use the position size calculator to determine lot size from your stop-loss distance.
Key Takeaways
- Fibonacci retracement divides a significant price move into percentage zones (23.6%, 38.2%, 50%, 61.8%, 78.6%) that mark potential areas of support or resistance
- Draw from the swing low to swing high (uptrend) or swing high to swing low (downtrend) using significant daily or weekly swing points
- The three most important levels are 38.2%, 50%, and 61.8% — focus here, not on every Fibonacci ratio
- Fibonacci levels are zones of interest, not automatic entry signals; always wait for price action confirmation (rejection candle, pattern) within the zone
- Confluence makes all the difference: when a Fibonacci level coincides with a pre-existing S/R zone, a moving average, or a trend line, the probability of a meaningful reaction increases significantly
- Use Fibonacci extensions (127.2%, 161.8%) to project take-profit targets beyond the original swing high
Next: Fibonacci and Trend Lines Combined | Caution When Trading Fibonacci
Tools: Position Size Calculator

Ready to Practice This Strategy?
Test what you learned on a free, risk-free demo account before risking real money.