Trading Trend Lines and Channels in Forex
Trend lines and price channels are among the most versatile tools in technical analysis. Learn to draw valid trend lines, identify channel types, trade bounces and breakouts, and avoid the most common drawing mistakes.
A trend line is one of the most primitive tools in technical analysis. Two points define a line, and you can draw it in seconds. That simplicity is also why it’s so widely misused — traders draw lines through any two price points and treat them as significant, when in reality they’re arbitrary.
Done correctly, trend lines identify the exact rate of ascent or descent in a trend, provide dynamic support and resistance, and generate some of the clearest entry signals in technical trading.
What Makes a Valid Trend Line
A trend line is a diagonal line connecting at least two significant price points. The critical word is significant.
For an uptrend line (connecting swing lows):
- Connect the most significant swing lows of the move — the lows that marked the start of each upward leg
- At least two points are needed to draw it; three or more touches validate it
- The line should touch the lowest wicks of the swing lows — not arbitrary mid-candle points
For a downtrend line (connecting swing highs):
- Connect the most significant swing highs
- The line should touch the highest wicks of the swing highs
Validity criteria:
| Criterion | Requirement |
|---|---|
| Minimum touches | 2 to draw; 3+ to validate |
| Touch quality | Price must clearly reject at the line (not just graze it) |
| Time span | The wider the time span between touches, the more significant the line |
| Angle | Lines steeper than 45° tend to break quickly; shallow lines are more durable |
| Higher timeframe | A trend line on the daily chart is more significant than on the 15M chart |
Adjusting Trend Lines
Price rarely respects a line drawn with absolute precision. When price slightly violates a trend line on a wick (but closes on the correct side), this is a test, not a break — don’t immediately redraw.
Minor adjustment rule: If price wicks beyond the trend line but closes back inside it, the line holds. Consider shifting the line slightly to accommodate the test if it improves the overall fit across multiple touches.
Major violation: If a candle closes beyond the trend line with significant body, the line has broken. Either redraw using the new price structure, or classify the line as broken and watch for a retest.
Price Channels: Two Lines Forming a Range
A price channel is formed by drawing two parallel lines — a primary trend line (on the swing lows in an uptrend) and a parallel channel line (on the swing highs).
Types of channels:
| Channel Type | Structure | What It Tells You |
|---|---|---|
| Ascending channel | Both lines sloping up; equal angle | Controlled uptrend; price bouncing in a defined range |
| Descending channel | Both lines sloping down | Controlled downtrend |
| Horizontal channel | Both lines flat | Ranging market; price oscillating between flat S/R |
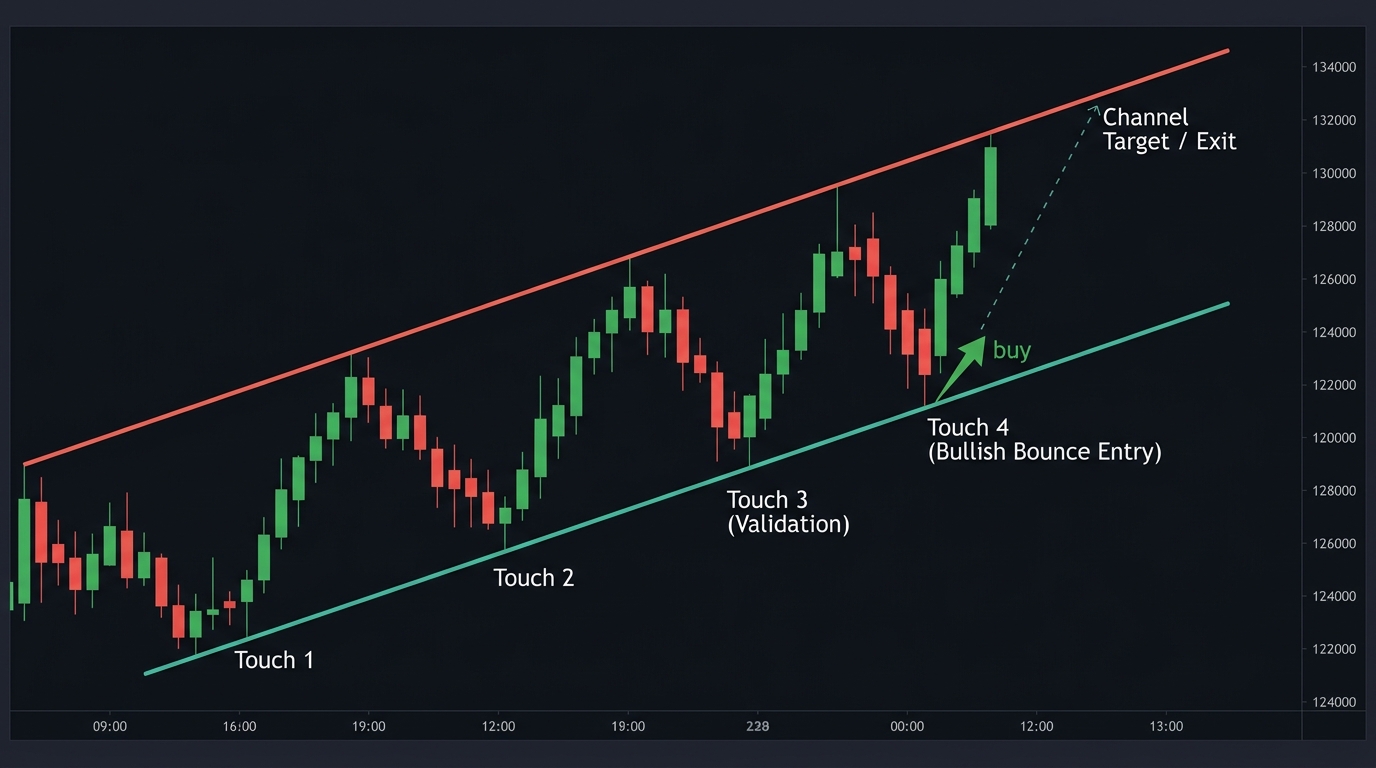
A well-formed channel has at least:
- 2 touches on the primary trend line (support side in uptrend)
- 2 touches on the channel line (resistance side)
With 4 total touches (2 on each line), the channel is validated and tradeable.
Trading Setups
Setup 1: Trend Line / Channel Bounce (Continuation)
The most frequent and reliable setup — trading a bounce off the primary trend line in the direction of the established trend.
| Step | Action |
|---|---|
| 1. Identify the trend | Clear ascending or descending price structure |
| 2. Draw the trend line | Connect 2+ significant swing lows (uptrend) |
| 3. Wait for price | Let price pull back toward the trend line |
| 4. Confirmation | Bullish rejection candle at or near the line |
| 5. Entry | Long at next candle open |
| 6. Stop-loss | Below the trend line (structure-based), 10–20 pip buffer |
| 7. Take-profit | Upper channel line (if channel exists) or previous swing high |
Setup 2: Channel Upper Boundary Short (Range Trade)
When price reaches the upper boundary of a well-established channel:
| Step | Action |
|---|---|
| 1. Confirm channel | At least 4 touches across both boundaries |
| 2. Wait for upper touch | Price approaches the channel upper line |
| 3. Confirmation | Bearish rejection candle at the upper line |
| 4. Entry | Short at next candle open |
| 5. Stop-loss | Above the upper channel line + 15-pip buffer |
| 6. Take-profit | Lower trend line (channel support) |
Setup 3: Trend Line / Channel Break (Reversal or Acceleration)
A confirmed close beyond the primary trend line signals a potential trend change or acceleration:
Break of uptrend line:
- Close below the ascending trend line
- Wait for a retest of the broken line (now acting as resistance)
- Rejection at the retest → enter short
- Stop above the retest high; target at previous swing low
Break of channel upper line (acceleration):
- Close above the upper channel line in an uptrend
- This is a bullish acceleration signal — the trend is strengthening beyond its normal rate
- Enter long on pullback to the upper channel line (now acting as support)
- Target: Project the channel height above the breakout level
Drawing Channels Correctly
The most common mistake: drawing the channel line first and then forcing the trend line to fit it. The correct order:
- Draw the primary trend line first (connecting swing lows in an uptrend)
- Draw the channel line parallel to it, positioned to touch the most significant swing high in the move
- Verify that at least 1–2 additional swing highs approximately touch the channel line
The channel line is derived from the trend line’s angle — not independently drawn.
Fan Lines and Trend Line Failures
When a trend line breaks, traders often draw a new, shallower trend line from the most recent swing low. This “trend fan” can repeat 2–3 times as a trend decelerates before reversing:
- First trend line (steepest): breaks early
- Second trend line (moderate): breaks after the first
- Third trend line (shallowest): breaks as trend finally reverses
When the third fan line breaks, the trend reversal is typically confirmed. This is a useful framework for identifying multi-stage trend exhaustion.
Risk Management
| Parameter | Recommendation |
|---|---|
| Risk per trade | 1% of account |
| Stop-loss | Beyond the trend line/channel boundary (10–20 pip buffer) |
| Minimum RR | 1:2 (channel bounce: from trend line to channel line and back is often naturally 1:2+) |
| Confirmation | Always require a rejection candle before entering at a line |
Use the position size calculator for exact lot sizing.
Key Takeaways
- A valid trend line requires at least 2 significant swing point touches; 3+ touches validate it; shallow angles are more durable than steep ones
- A price channel adds a parallel line on the opposite side, validated by 2+ touches on each boundary (4 total)
- Three main setups: trend line bounce (continuation), channel upper boundary short (range), and trend line break with retest (reversal)
- Never draw the channel line first — derive it from the angle of the primary trend line
- A wicked violation that closes on the correct side is a test, not a break; a candle body closing beyond the line is a break
- Fan lines (successive shallower trend lines) identify multi-stage trend deceleration; a break of the third fan line often confirms reversal
Next: Fibonacci Retracement | Methods to Establish Support and Resistance
Related strategies: EMA Crossover and ADX
Tools: Position Size Calculator

Ready to Practice This Strategy?
Test what you learned on a free, risk-free demo account before risking real money.