Head and Shoulders Pattern: The Most Reliable Reversal Signal in Forex
The head and shoulders is the most widely recognized reversal chart pattern in technical analysis. Learn to identify it correctly, draw the neckline, set stop-losses and targets, and distinguish the inverse (bullish) variant.
The head and shoulders pattern appears in nearly every technical analysis textbook for a reason: it is statistically one of the most reliable chart reversal signals in forex trading. Multiple peer-reviewed studies over several decades consistently find that the pattern resolves in the expected direction at rates between 60% and 80% when confirmed correctly.
That said, it’s also one of the most commonly misidentified patterns. Traders see three peaks and call it head and shoulders when the structure doesn’t meet the actual criteria. This lesson explains exactly what constitutes a valid pattern, how to trade it with precision, and what separates the high-probability setups from the noise.
What Is the Head and Shoulders Pattern?
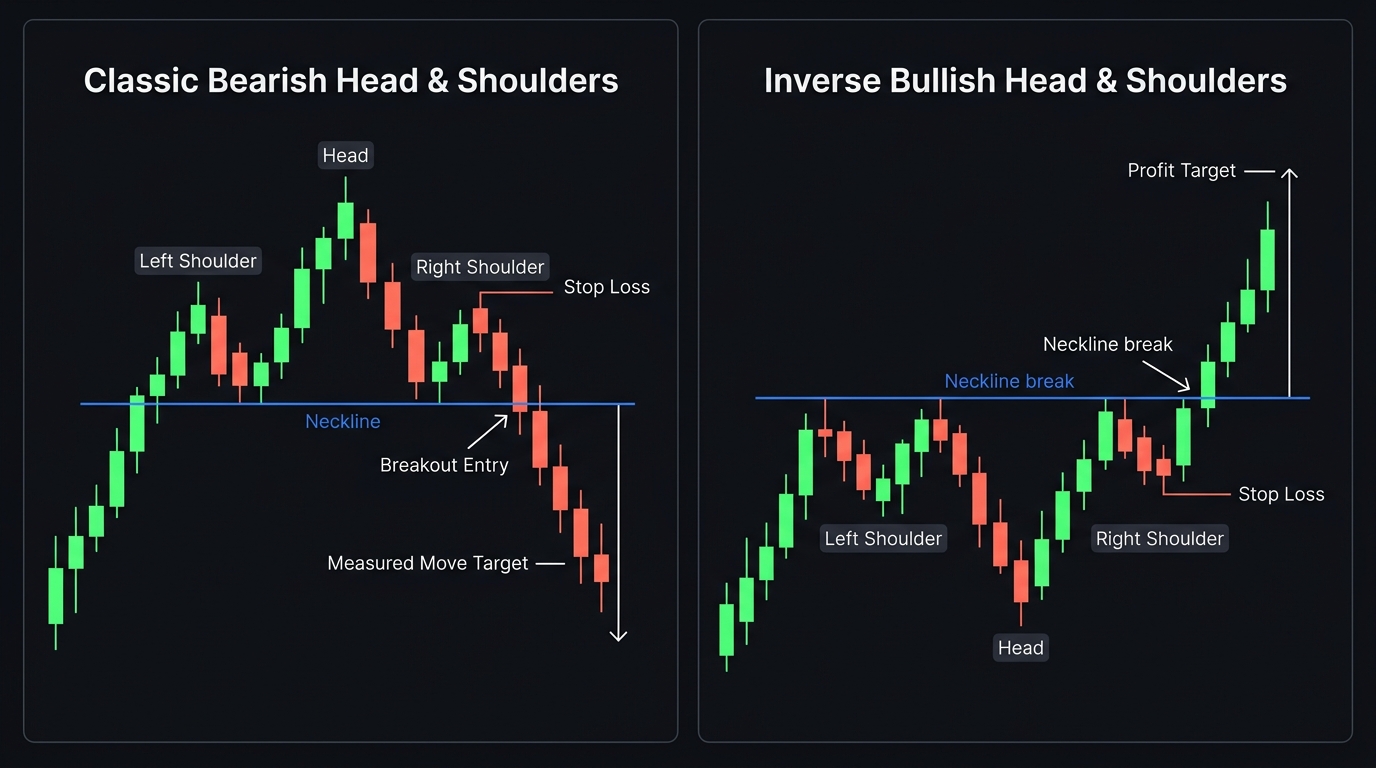
The head and shoulders is a three-peak reversal pattern that appears at the top of an uptrend. It signals that the uptrend is exhausting and a bearish reversal is likely.
Structure:
- Left shoulder: A new high is reached, then price pulls back
- Head: Price rallies to a higher high (higher than the left shoulder), then pulls back again
- Right shoulder: Price rallies again but fails to reach the head’s high — a lower high
- Neckline: A line connecting the two pullback lows between the shoulders and the head
The pattern is confirmed when price breaks below the neckline.
What this structure tells you: Buyers attempted a new high three times. The first attempt (left shoulder) succeeded. The second attempt (head) succeeded — a new high was made. But on the third attempt (right shoulder), buyers failed to reach the head. Each successive high is attracting less buying pressure. The uptrend is losing momentum. When price breaks the neckline, the pattern is confirmed.
Identifying a Valid Head and Shoulders
Not every three-peak formation is a valid head and shoulders. These criteria distinguish high-quality from questionable setups:
| Criterion | Requirement |
|---|---|
| Prior trend | Must occur after a meaningful uptrend — not at random |
| Head | Must be clearly the highest of the three peaks |
| Shoulders | Left and right shoulders should be approximately at the same height (within 10–20% of each other) |
| Neckline | Should be approximately horizontal or slightly rising — not steeply angled |
| Volume | Ideally: declining on the head, further declining on the right shoulder, then surging on the neckline break |
| Symmetry | The right shoulder should take approximately the same time to form as the left shoulder |
The volume pattern is particularly significant: decreasing volume on successive peaks confirms that buying pressure is genuinely fading, not just randomly pausing.
Drawing the Neckline
The neckline is drawn by connecting:
- The lowest point of the pullback after the left shoulder
- The lowest point of the pullback after the head
Extend this line to the right. The neckline is the trigger level — the pattern is confirmed when price closes below it.
Neckline variations:
- Horizontal neckline: The cleanest and most reliable version
- Slightly rising neckline: Still valid, requires a slightly more patient entry (price needs to fall further to break)
- Steeply declining neckline: Less reliable; the break is less meaningful when the neckline has already been sloping down
Entry Rules
Entry Method 1: Neckline Break (Aggressive)
| Step | Action |
|---|---|
| 1. Confirm the pattern | All structural criteria met |
| 2. Wait for neckline break | Price closes below the neckline on 4H or Daily chart |
| 3. Entry | Enter short at the next candle open |
| 4. Stop-loss | Above the right shoulder high |
| 5. Take-profit | Measured move target (see below) |
Entry Method 2: Neckline Retest (Conservative)
After breaking the neckline, price often pulls back to retest it from below (the neckline, now acting as resistance):
| Step | Action |
|---|---|
| 1. Wait for break | Price closes below neckline |
| 2. Wait for retest | Price pulls back up toward the broken neckline |
| 3. Confirmation | Bearish rejection candle forms at the neckline |
| 4. Entry | Short at next candle open after rejection |
| 5. Stop-loss | Above the neckline (+ small buffer) |
| 6. Take-profit | Measured move target |
The retest entry offers a better risk-reward ratio (tighter stop to the neckline vs. the right shoulder) but carries the risk of missing the trade if there is no retest.
Calculating the Price Target (Measured Move)
The measured move projection is calculated by:
Height = Head high price − Neckline price at the head
Target = Neckline break price − Height
Example:
- Head high: 1.1250
- Neckline at that point: 1.1100
- Height: 150 pips
- Neckline break price: 1.1090
- Target: 1.1090 − 0.0150 = 1.0940
The measured move provides the minimum expected downside target. Price often exceeds it when the pattern forms during a significant trend reversal.
Head and Shoulders on Different Timeframes
| Timeframe | Pattern Significance | Trade Duration |
|---|---|---|
| Daily chart | Highest significance; major trend reversal | Weeks to months |
| 4H chart | Significant; medium-term reversal | Days to weeks |
| 1H chart | Moderate; short-term setup | Hours to days |
| 15M or below | Lower reliability; prone to false breaks | Not recommended |
A head and shoulders on the daily chart that coincides with a key resistance zone is a significantly stronger setup than the same pattern on a 1H chart in open space.
The Inverse Head and Shoulders (Bullish Reversal)
The inverse head and shoulders is the exact mirror pattern, appearing at the bottom of a downtrend.
Structure:
- Left shoulder: Price makes a new low, then bounces
- Head: Price falls to a lower low (the lowest point of the pattern), then bounces
- Right shoulder: Price falls again but makes a higher low than the head
- Neckline: Connects the two bounce highs between the shoulders and head
- Confirmation: Price breaks above the neckline
All the same rules apply — symmetry, volume increase on the breakout, measured move projection — but in the opposite direction.
The inverse pattern signals that sellers are failing to push price to new lows on successive attempts, and that buyers are gaining control. The neckline break confirms the reversal.
Common Mistakes
Identifying the pattern too early: The right shoulder must be fully formed and the neckline broken before the pattern is confirmed. Many traders short during what they think is the right shoulder — but price makes a new high and the pattern is invalidated.
Ignoring the neckline slope: A neckline sloping steeply down is not a horizontal neckline. The break of a steeply declining neckline is less significant.
Skipping the measured move: Trading without a target means exits are driven by emotion. Always calculate the measured move before entering.
Entering on an unfilled pattern: If only the left shoulder and head are visible, the pattern does not exist yet. Both shoulders must be complete, and the neckline must be broken, before trading it.
Risk Management
| Parameter | Recommendation |
|---|---|
| Risk per trade | 1% of account |
| Stop-loss | Above right shoulder high (neckline break) or above neckline (retest entry) |
| Take-profit | Measured move minimum target |
| Confirmation | Candle close below neckline (not just an intrabar touch) |
| False break buffer | Only trade confirmed daily or 4H closes — not 1H |
Use the position size calculator for precise lot sizing.
Key Takeaways
- The head and shoulders is a three-peak reversal pattern (left shoulder, head at the top, right shoulder lower than head) that signals the end of an uptrend
- Confirmation requires a price close below the neckline — not just a touch or intrabar spike
- Two entry methods: aggressive neckline break entry, or conservative retest entry when price pulls back to the broken neckline
- The measured move target = neckline break price minus the height of the pattern (head to neckline)
- The inverse head and shoulders is the bullish mirror of the same pattern, appearing at downtrend bottoms
- Volume pattern confirms the pattern: declining on the head, declining further on the right shoulder, surging on the neckline break
Next: Elliott Wave Theory | Fibonacci and Trendlines
Related strategies: Support and Resistance
Tools: Position Size Calculator

Ready to Practice This Strategy?
Test what you learned on a free, risk-free demo account before risking real money.