Tops and Bottoms in Forex: Identifying Major Reversal Patterns
Market tops and bottoms represent the end of sustained trends and the beginning of new ones. Learn to identify the five major topping and bottoming formations, their confirmation requirements, and the entry setups they produce.
Every sustained trend ends. The question is not whether it will end, but whether you can recognize the signs before the reversal is fully established. The patterns that appear at market extremes — tops and bottoms — are among the most studied and most profitable in technical analysis when correctly identified.
The challenge is that tops and bottoms are only obvious in hindsight. This lesson focuses on the specific structural and momentum signals that increase the probability of correctly identifying a reversal in real time.
Why Tops and Bottoms Form
A top forms when buying pressure exhausts itself. The most common sequence:
- A sustained uptrend brings in increasingly late buyers
- Sellers begin absorbing the buying pressure at progressively higher prices
- Each new rally reaches slightly lower than the last, or fails to attract the same buying volume
- A final push creates a structural peak; the momentum to sustain higher prices is no longer there
- Selling pressure overcomes buying; the reversal begins
Bottoms form through the mirror process. The key insight: by the time a top or bottom is obvious to most participants, the reversal is already underway. The edge comes from recognizing the early structural signals.
The Five Major Reversal Patterns
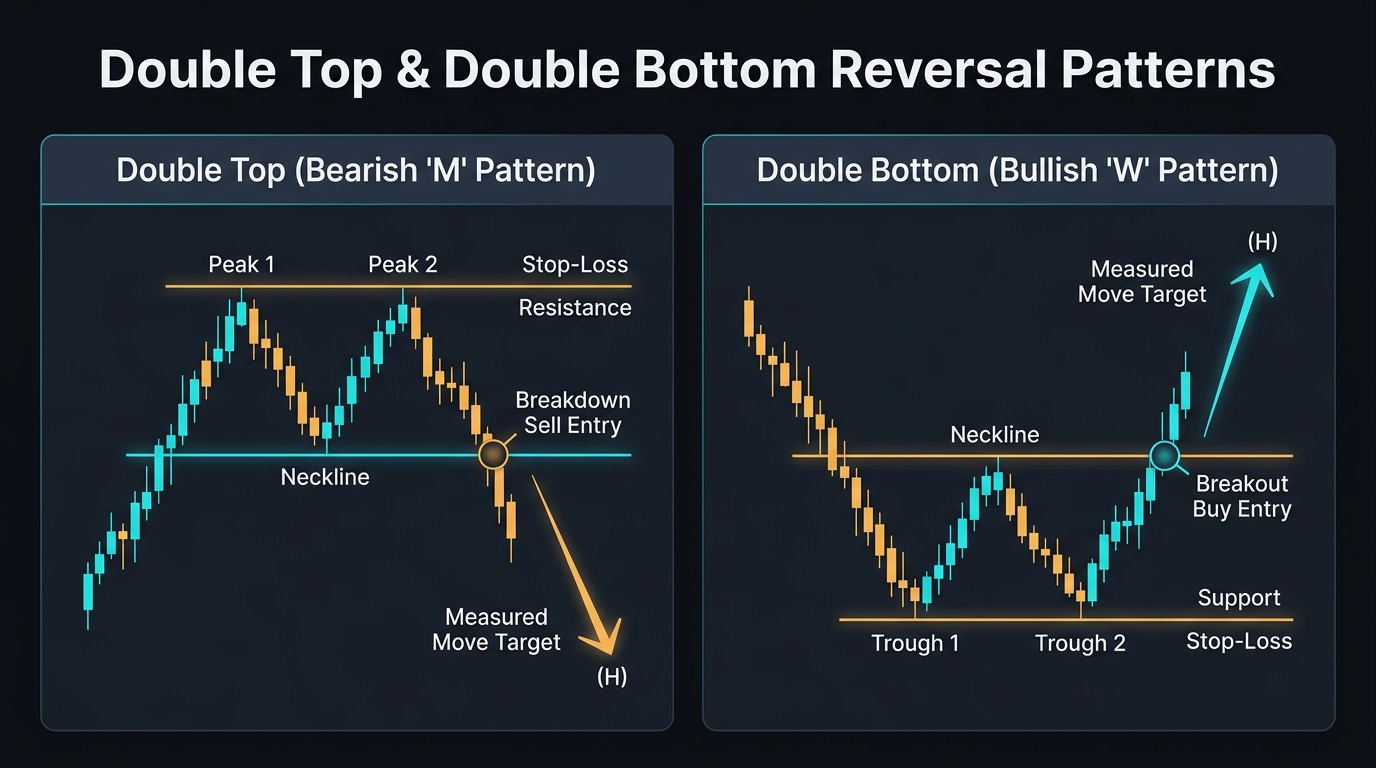
1. Double Top
Structure: Two roughly equal highs separated by a trough (the neckline support). Price fails to make a new high on the second attempt.
Confirmation: Close below the neckline (the trough between the two tops).
Measured move target: Neckline − Pattern Height (the distance from the neckline to the tops).
Signal quality: High — the failure to break the previous high explicitly shows buyers are losing control.
2. Double Bottom
Mirror of the Double Top: two equal lows separated by a peak (the neckline resistance). Confirmed on a close above the neckline.
3. Head and Shoulders (Topping)
Structure: Three peaks — a higher middle peak (the “head”) flanked by two lower peaks (the “shoulders”). The neckline connects the two troughs between the peaks.
Confirmation: Close below the neckline (often slanted slightly).
Measured move target: Neckline − Head height (distance from neckline to the head’s peak).
Signal quality: Very High — the three-peak failure sequence with a progressively lower right shoulder is a strong exhaustion signal. See the complete Head and Shoulders lesson.
4. Triple Top / Triple Bottom
Structure: Three tests of the same level (resistance or support) with the third test failing — producing three equal highs (top) or three equal lows (bottom).
Why triple is more significant than double: Three failures represent more accumulated evidence of the level’s significance. Sellers who defended the resistance three times have demonstrated greater conviction than those who defended it twice.
Confirmation: Same as Double Top/Bottom — close beyond the neckline.
5. V-Shape Reversal (Spike and Reversal)
Structure: A sharp, fast reversal — price makes a new extreme (high or low) and reverses sharply within 1–3 candles. No pattern formation; just a rapid rejection.
When it appears: Usually after a major news event or market shock. The extreme move triggers cascading stops, overshooting the “fair” price. The reversion back toward fair value creates the V-shape.
Trading it: The V-shape is the hardest reversal to trade because it’s only identifiable in real time during extremely fast conditions. Most practitioners trade the subsequent retest of the V’s extreme (waiting for a pullback to the spike level) rather than trying to catch the initial reversal.
Momentum Divergence: The Early Signal
Before any of the above patterns complete their confirmation (neckline break), momentum divergence often provides advance warning.
Bearish divergence at a top:
- Price makes a new high (higher high)
- RSI or MACD simultaneously makes a lower high
- This “divergence” means price is making new highs but momentum is weaker — buyers are less committed at the new high than they were at the previous high
Bullish divergence at a bottom:
- Price makes a new low (lower low)
- RSI or MACD makes a higher low
- Sellers are losing momentum at the new low
Divergence alone is not a trading signal. Price can continue beyond a divergence for many sessions before reversing. Use it as a warning to look for pattern confirmation — not as an entry trigger by itself.
Confirmation Requirements
Never trade a reversal pattern without confirmation:
| Pattern | Minimum Confirmation |
|---|---|
| Double Top | 4H or Daily candle close below neckline |
| Double Bottom | 4H or Daily close above neckline |
| Head and Shoulders | Close below neckline; retest of neckline as resistance preferred |
| Triple Top/Bottom | Same as Double Top/Bottom |
| V-Shape Reversal | Retest of the V-extreme with rejection candle |
The retest entry is superior to the neckline close entry for two reasons:
- The neckline close may be a false break — the retest confirms the break is genuine
- Entry on the retest provides a tighter stop (above the retest high) versus entry at the neckline close (which requires a stop well beyond the neckline)
False Top / False Bottom Warning
The most dangerous scenario is entering a reversal position that is actually a continuation pause:
- In a strong uptrend, a double top can form and confirm (close below neckline) before price reverses right back up and continues higher
- False reversals are more common when the primary trend is very strong (ADX above 40) and the pattern is relatively small compared to the overall move
Reducing false reversal risk:
- Require multiple time frame confirmation (the pattern should be visible on the 4H chart and the daily chart, not just a smaller timeframe)
- Require momentum divergence as a supporting factor
- Size positions conservatively at reversal entries — they carry higher risk than trend continuation entries
Key Takeaways
- Five major reversal patterns: Double Top/Bottom, Head and Shoulders, Triple Top/Bottom, and V-Shape
- All require a neckline break confirmation before entering — a pattern that doesn’t confirm its neckline break is not a tradeable reversal signal
- The retest entry (entering when price pulls back to test the broken neckline) is more reliable than the breakout entry and provides a tighter stop
- Momentum divergence (RSI/MACD making opposite highs/lows vs. price) provides early warning before pattern confirmation — use it to prepare, not to enter
- False reversals are more common in strongly trending markets — require larger pattern scale and multi-timeframe confirmation in high-ADX environments
- The measured move target (neckline ± pattern height) provides a minimum price projection for the reversal
Related lessons: Head and Shoulders | Chart Patterns: Rectangles and Triangles
Related strategies: RSI Strategy — divergence applications

Ready to Practice This Strategy?
Test what you learned on a free, risk-free demo account before risking real money.