ABC Consumer Comfort Index
The ABC News/Langer Research Consumer Comfort Index (CCI) is a high-frequency weekly macroeconomic sentiment barometer tracking American household perceptions across three core dimensions: current personal finances, the state of the national economy, and the immediate buying climate.
What Is the ABC Consumer Comfort Index?
In macroeconomic analysis, financial market forecasting, and high-frequency econometric modeling, the ABC News Consumer Comfort Index (CCI)—produced by Langer Research Associates—is a continuous weekly survey of consumer sentiment in the United States.
While traditional sentiment metrics (such as the University of Michigan Index of Consumer Sentiment and the Conference Board Consumer Confidence Index) are published only once or twice a month, the ABC Consumer Comfort Index provides weekly rolling data released every Thursday morning. Because consumer spending accounts for approximately 68% to 70% of total US Gross Domestic Product (GDP), real-time shifts in household comfort provide macro traders and central bank watchers with rapid leading insights into retail sales, discretionary spending trends, and labor market sentiment.
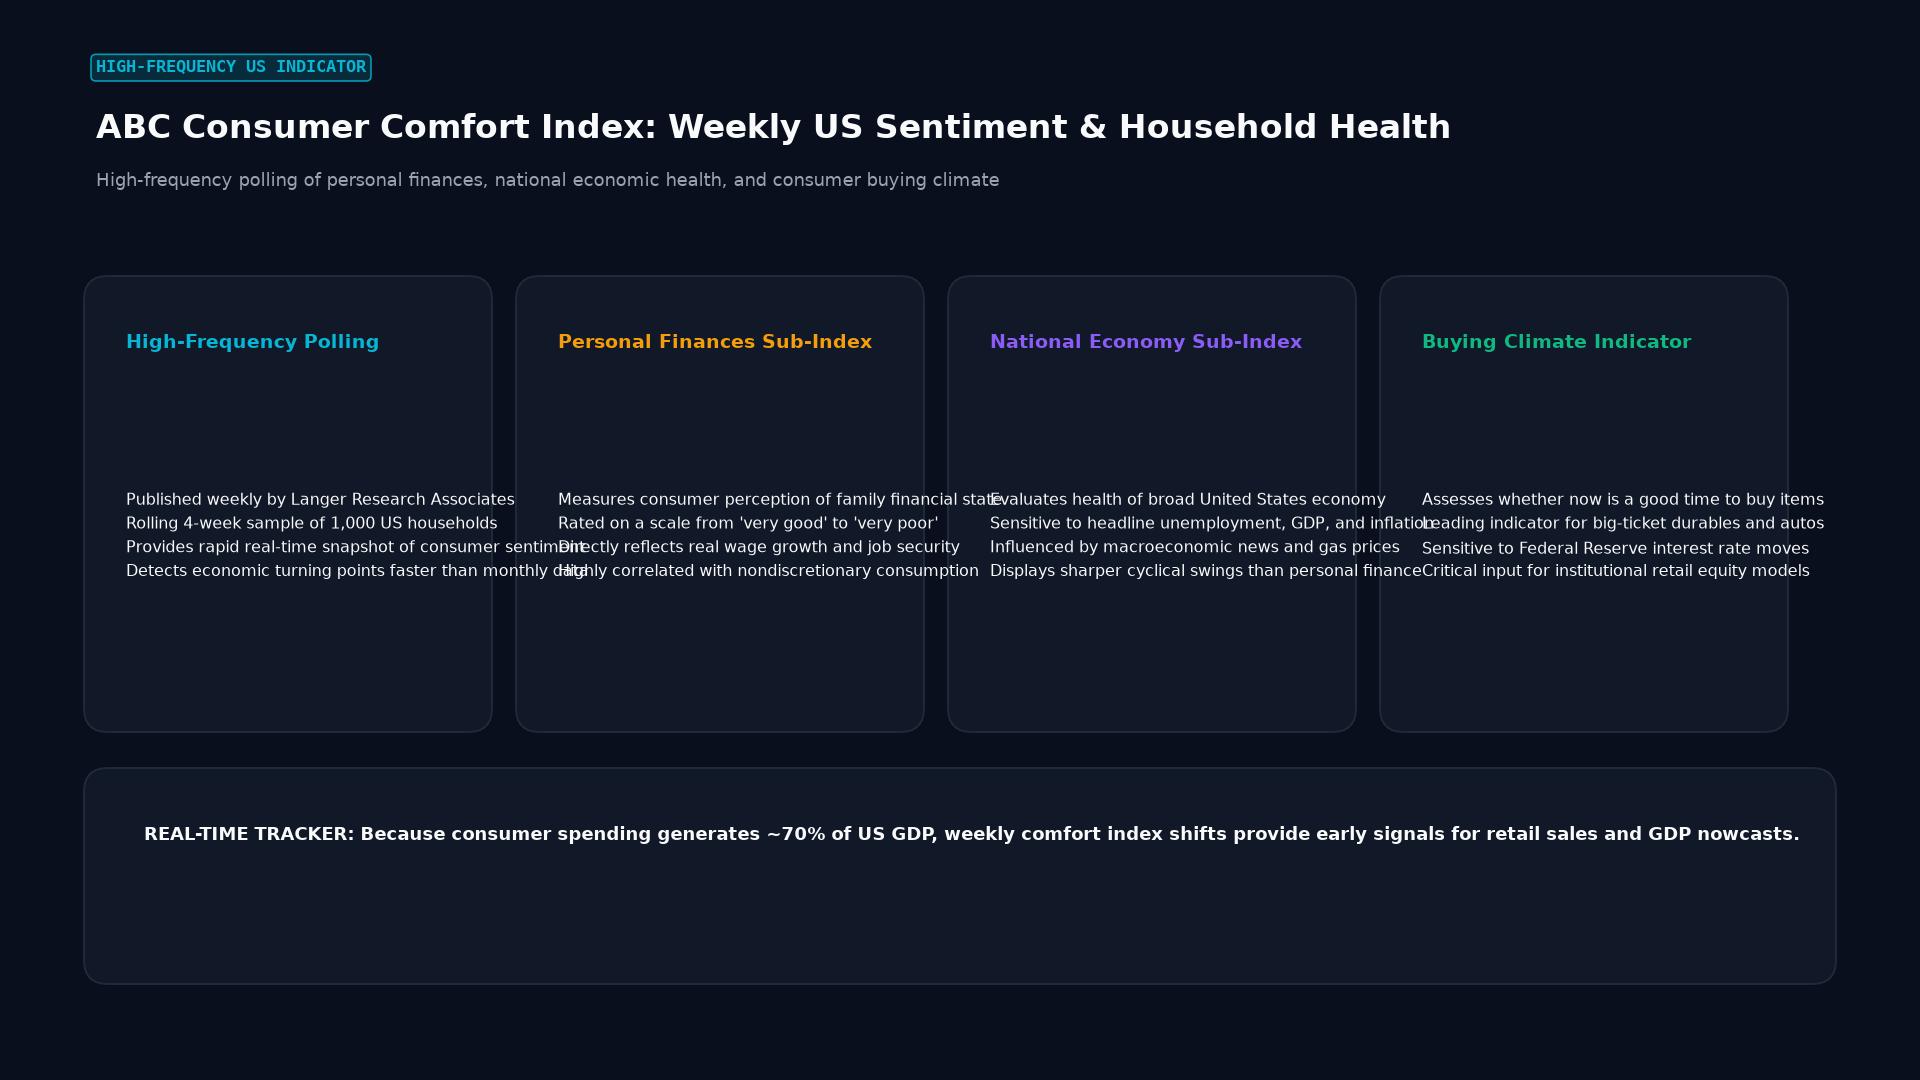 Figure: High-frequency polling of personal finances, national economic health, and consumer buying climate
Technical Mechanics & Calculation Methodology
The Consumer Comfort Index is built upon a rolling four-week telephone and online survey of 1,000 randomly selected American adults across all income brackets and geographic regions:
1. The Three Sub-Indices
Respondents evaluate each component on a four-point scale (Excellent, Good, Not so good, Poor):
- Personal Finances Sub-Index: Measures current household balance sheet strength, savings rate perception, and wage adequacy.
- National Economy Sub-Index: Captures macroeconomic sentiment regarding GDP growth, headline inflation, and unemployment.
- Buying Climate Sub-Index: Evaluates consumer willingness to spend discretionary income on consumer durable goods, automobiles, and home appliances.
2. Composite Diffusion Formula
Each sub-index calculates the net percentage difference between positive responses (Excellent/Good) and negative responses (Not so good/Poor):
$$\text{Sub-Index Score} = % \text{Positive} - % \text{Negative}$$
The composite ABC Consumer Comfort Index converts these net scores onto an intuitive 0 to 100 scale, where:
- A score of 50 represents neutral equilibrium.
- Scores above 50 indicate net positive consumer optimism and economic expansion.
- Scores below 50 indicate net household distress (the index dropped below 25 during the depths of the 2008–2009 Great Financial Crisis).
Comparative Matrix: Major US Consumer Sentiment Indicators
| Indicator | Frequency | Sample Size | Primary Focus | Publishing Organization |
|---|---|---|---|---|
| ABC Consumer Comfort Index | Weekly (every Thursday) | 1,000 rolling adults | Real-time current household conditions & buying climate | Langer Research / ABC News |
| University of Michigan Sentiment (MCSI) | Bi-weekly (Prelim & Final) | ~500 respondents | Expected inflation expectations & 5-year economic outlook | University of Michigan |
| Conference Board Consumer Confidence | Monthly (last Tuesday) | ~5,000 households | Present labor market conditions & 6-month job expectations | The Conference Board |
Real-World Case Study: High-Frequency Warning in Retail Sales
During the third quarter of 2022, financial markets were intensely focused on whether rising Federal Reserve interest rate hikes would trigger an immediate recession:
- The Monthly Lag: The Conference Board Consumer Confidence Index showed steady sentiment throughout August, buoyed by strong headline payroll figures.
- The Weekly Breakdown in ABC CCI: In early September, the weekly ABC Consumer Comfort Index began a steep three-week slide, falling from 41.2 to 34.8.
- Sub-Index Divergence: The granular breakdown revealed that while the Personal Finances sub-index held steady, the Buying Climate sub-index crashed by 9 points, as surging credit card interest rates and gasoline prices caused consumers to delay large-ticket purchases.
- Market Front-Running: Quantitative macro funds monitoring the high-frequency ABC data took short positions on retail exchange-traded funds (such as the SPDR S&P Retail ETF, XRT) two weeks before official Commerce Department monthly retail sales figures were released, capitalizing on a sharp -1.1% retail print that surprised consensus Wall Street estimates.
Frequently Asked Questions (FAQ)
Why is weekly frequency advantageous for macroeconomic traders?
Monthly economic reports suffer from publication lags; by the time monthly retail sales or consumer confidence indices are reported, the data is often 3 to 6 weeks old. The ABC Consumer Comfort Index provides weekly updates that capture real-time shocks—such as sudden stock market corrections, regional banking stress, or gasoline price spikes—days after they occur.
Which sub-index has the highest correlation with durable goods orders?
The Buying Climate Sub-Index exhibits the strongest statistical correlation ($R^2 \approx 0.65$) with discretionary consumer spending and durable goods purchases (appliances, electronics, vehicles), making it a favorite variable in predictive GDP nowcasting models.
How does income demographic segmentation enhance the index?
Langer Research breaks down the ABC CCI across income quartiles (e.g., households earning under $50,000 vs. over $100,000). This segmentation often reveals significant economic bifurcation, such as when affluent consumers maintain high spending comfort while lower-income households face severe budget compression due to food and rent inflation.
Ready to trade forex?
Open a free demo account with a regulated broker. Practice with virtual funds before risking real money.