Consumer Price Index (CPI)
The Consumer Price Index (CPI) measures the average change in prices paid by consumers for a fixed basket of goods and services over time. It is the most widely used measure of inflation and one of the most market-moving economic indicators in forex. CPI data directly influences central bank interest rate decisions and therefore drives currency valuation.
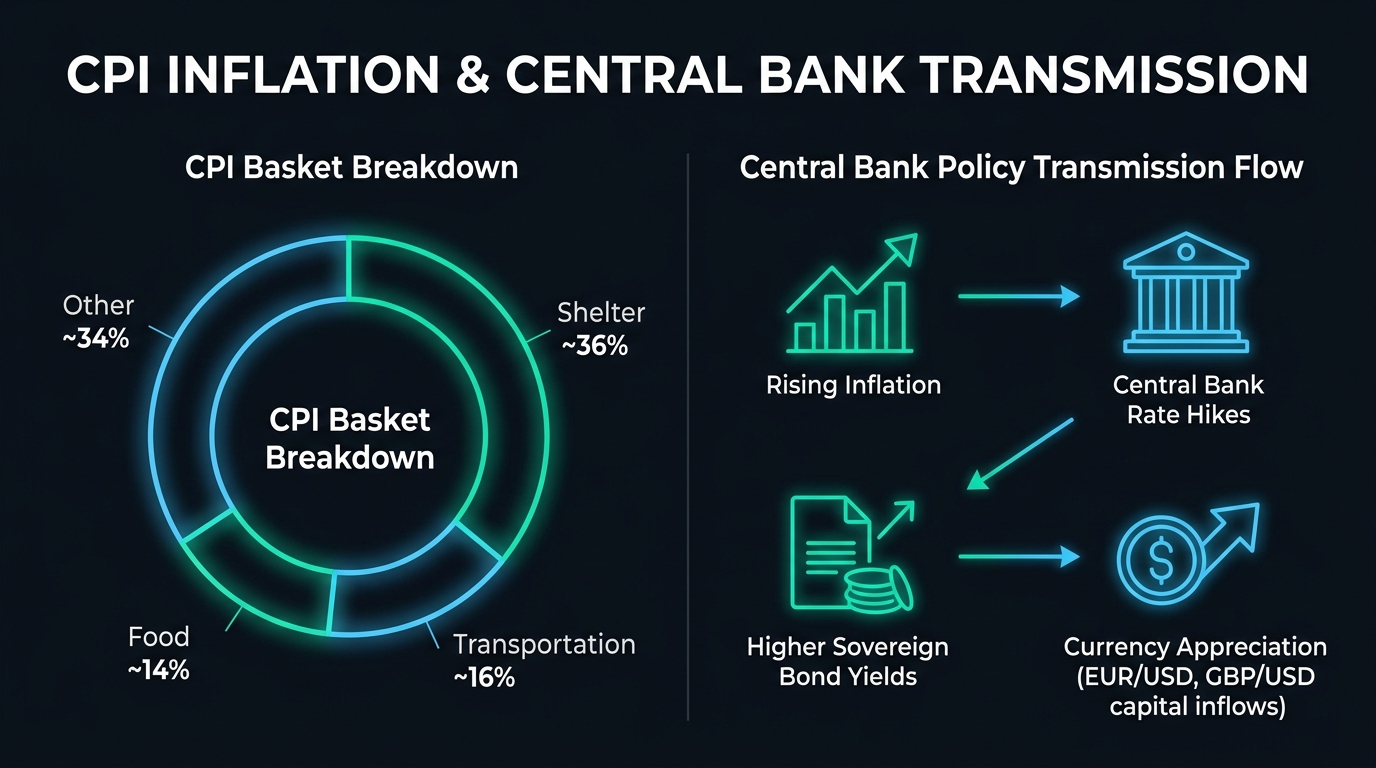
CPI: The Inflation Report Card
Every month, statistical agencies around the world send teams of data collectors to thousands of stores, websites, and service providers, recording prices for hundreds of specific items — a gallon of milk, a gallon of gasoline, a doctor’s visit, a month of rent, a movie ticket. They aggregate these prices into a composite index, compare it to last month and last year, and publish the result as the Consumer Price Index.
This report card on inflation is among the most market-moving scheduled events in the forex calendar, second only to major central bank decisions and (in the US context) Non-Farm Payrolls. Currency traders watch CPI because it tells the central bank whether to raise rates, hold them, or cut — and central bank rate expectations are the primary driver of currency valuation.
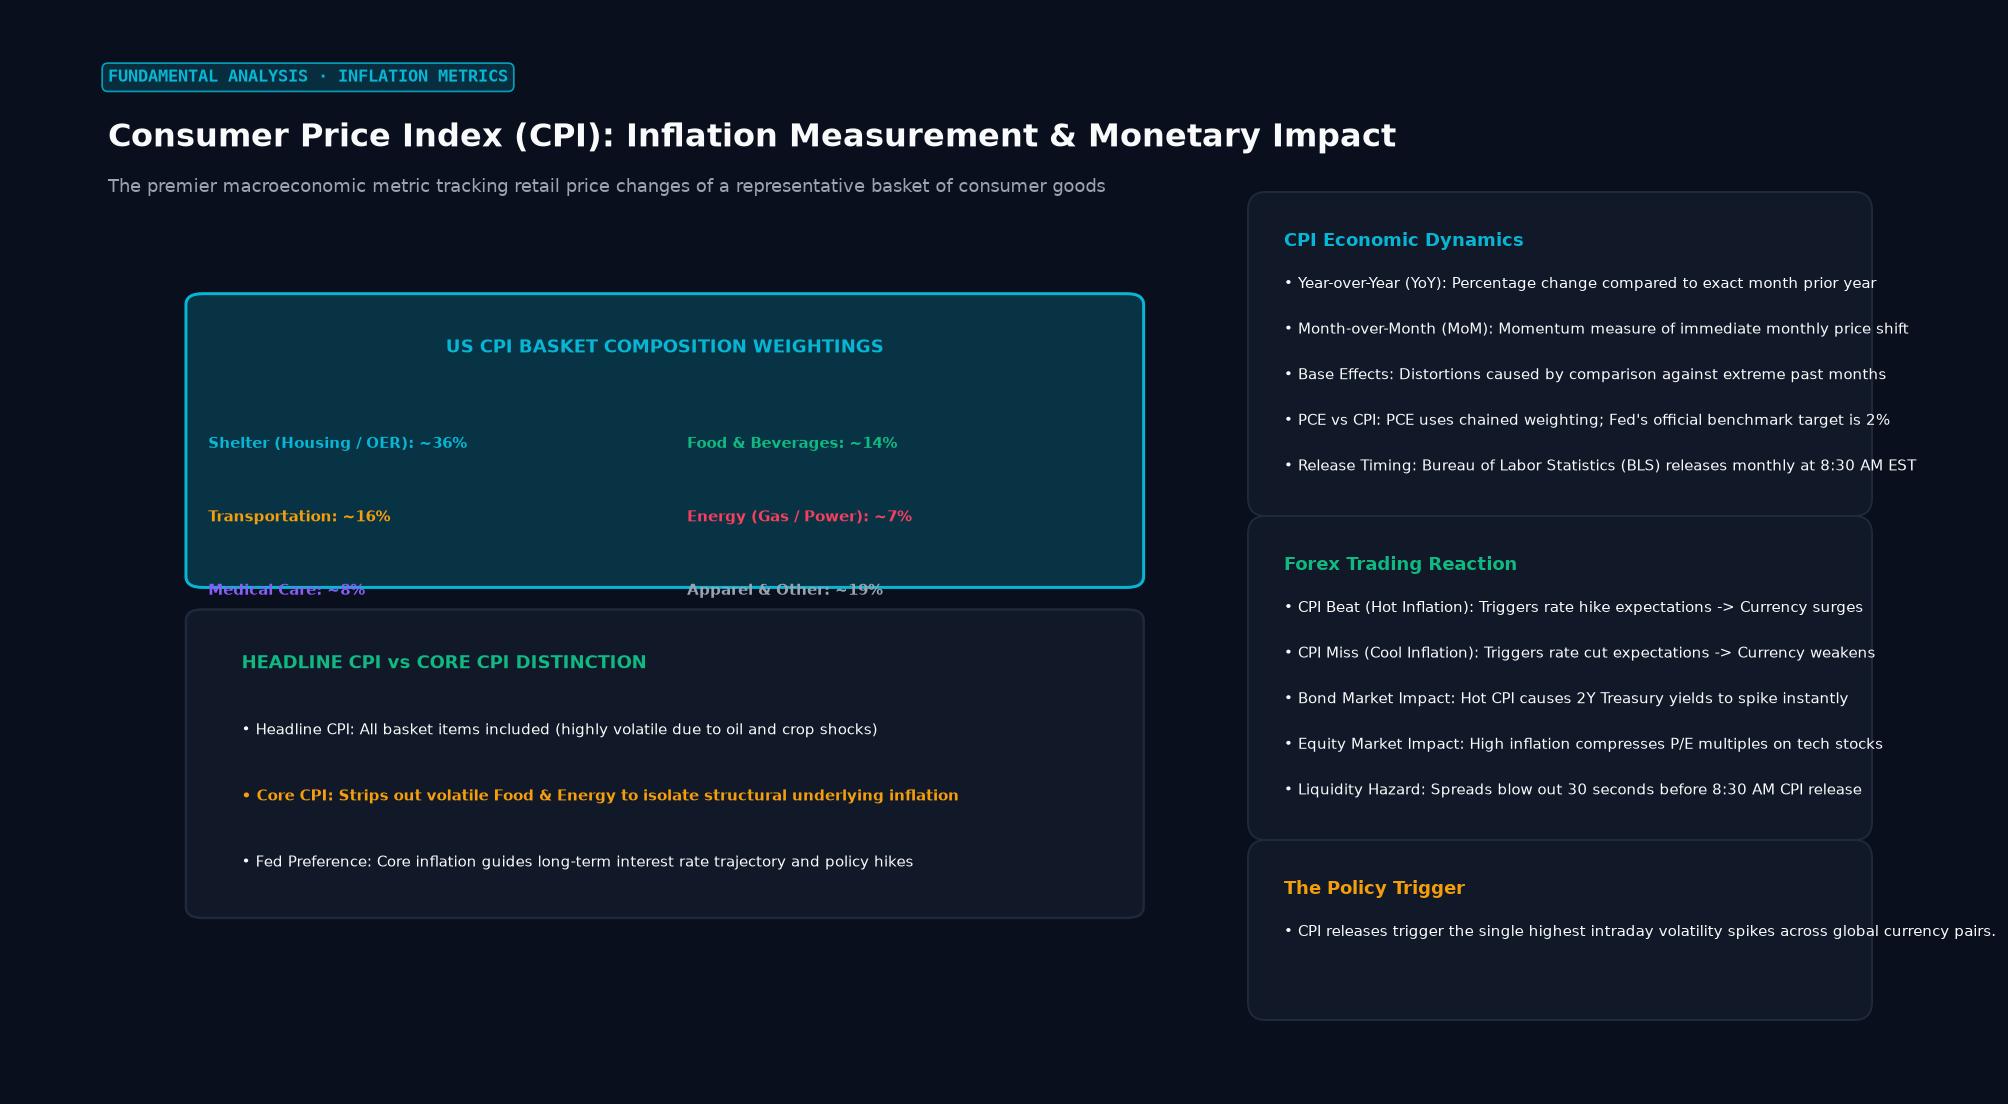 Figure: The premier macroeconomic metric tracking retail price changes of a representative basket of consumer goods
How CPI Is Structured
The CPI basket is divided into major categories, each with a specific weight reflecting how the average consumer actually spends money. In the US (as of recent BLS data):
| Category | Approximate Weight |
|---|---|
| Shelter (rent, owners’ equivalent rent) | ~36% |
| Food | ~14% |
| Transportation | ~16% |
| Medical care | ~7% |
| Education & communication | ~6% |
| Apparel | ~3% |
| Energy | ~7% |
| Other | ~11% |
The weights are updated periodically to reflect actual spending patterns. Shelter is the single largest component and the reason US CPI remained elevated longer than the Fed expected in 2022-2023 — rents in the CPI basket reflect contracts signed months earlier, creating a lag between actual market rent changes and what CPI records.
Headline CPI vs. Core CPI
Headline CPI includes everything — food, energy, the full basket. This is what’s reported in the news.
Core CPI strips out food and energy. Why? Food and energy prices are highly volatile and heavily influenced by supply-side factors (weather, geopolitical events, OPEC decisions) unrelated to domestic monetary conditions. Core CPI gives a cleaner view of the underlying inflation trend that monetary policy can actually address.
The Federal Reserve and most major central banks focus on core measures when setting policy. But headline CPI is what consumers experience — and what politicians respond to. During the 2022 inflation surge, US headline CPI peaked at 9.1% in June 2022 while core peaked slightly later at 6.6%. Both mattered; they told different parts of the story.
CPI Releases and Market Reaction
The US CPI release (by the Bureau of Labor Statistics, typically around the 10th-12th of each month at 08:30 EST) is a top-tier market event. The UK’s ONS, the Eurostat for the Eurozone, and equivalent agencies across the world release their own CPI reports on varying schedules.
Market reaction follows the same logic as all economic data: the surprise matters, not the absolute level. If consensus expects US CPI at 3.4% and it prints at 3.7%, that’s a hot surprise — the market prices in fewer rate cuts or more rate hikes, the dollar strengthens, EUR/USD falls, Treasury yields rise.
The opposite: CPI prints at 3.1% when consensus was 3.4% — a cool surprise. Rate cut expectations increase, the dollar weakens, EUR/USD rallies.
Magnitude of the surprise drives magnitude of reaction. A 0.1% beat produces modest moves. A 0.4-0.5% beat produces the kind of 100-150 pip moves that generate headlines.
CPI vs. PCE: Which Inflation Measure Does the Fed Actually Target?
The Federal Reserve’s official 2% inflation target is expressed in terms of the Personal Consumption Expenditures (PCE) price index, not CPI. PCE and CPI differ in methodology:
- PCE adjusts for changes in consumer behavior (if beef gets expensive and consumers switch to chicken, PCE captures this; CPI doesn’t)
- PCE has different weights — notably a smaller weight on shelter, which is why PCE typically runs 0.3-0.5 percentage points below CPI
For trading purposes: both CPI and PCE move markets, but the Fed’s language will reference PCE. A 2.8% CPI reading when PCE is 2.3% might not concern the Fed as much as those two numbers suggest. Understanding both helps.
Key Takeaways
- CPI measures average price changes in a fixed basket of consumer goods and services
- Shelter is the largest single component (~36% in the US) and one of the stickiest
- Core CPI (ex food and energy) is more policy-relevant; headline CPI is more politically visible
- Market reaction to CPI is driven by the surprise vs. consensus expectations, not the absolute reading
- The Fed targets PCE, not CPI — PCE typically runs 0.3-0.5pp below CPI
FAQ
If CPI falls, does that mean prices are falling? Not necessarily. CPI falling from 5% to 3% means inflation is slowing — prices are still rising, just more slowly. That’s disinflation. Actual price decreases would require negative CPI — which is deflation, a much rarer and more dangerous economic condition.
How often does CPI data get revised? Less frequently than employment data. Initial CPI readings are generally considered reliable; significant revisions are uncommon. However, the annual benchmark revision (released each February for the US) sometimes restates the prior year’s CPI readings and can shift the narrative on how much progress was made on inflation.
Ready to trade forex?
Open a free demo account with a regulated broker. Practice with virtual funds before risking real money.