Accounts Receivable Turnover
The Accounts Receivable Turnover ratio is an activity and liquidity metric that quantifies how efficiently a company collects revenue from its credit customers by measuring how many times average accounts receivable are collected and replaced during an accounting period.
What Is Accounts Receivable Turnover?
The Accounts Receivable Turnover ratio (also known as the receivables turnover or debtors turnover ratio) is a fundamental financial efficiency metric that measures how effectively an enterprise extends credit and collects payments from its commercial clients.
In corporate financial analysis, the ratio quantifies the number of times a company collects its average accounts receivable balance over a designated accounting timeframe (typically one fiscal year or quarter). A higher receivables turnover ratio indicates that a company operates an efficient credit and collections department, maintains conservative credit approval standards, and rapidly converts credit sales into liquid cash. Conversely, a declining ratio signals collection bottlenecks, lenient customer credit policies, or an increasing risk of uncollectible bad debts that can paralyze working capital.
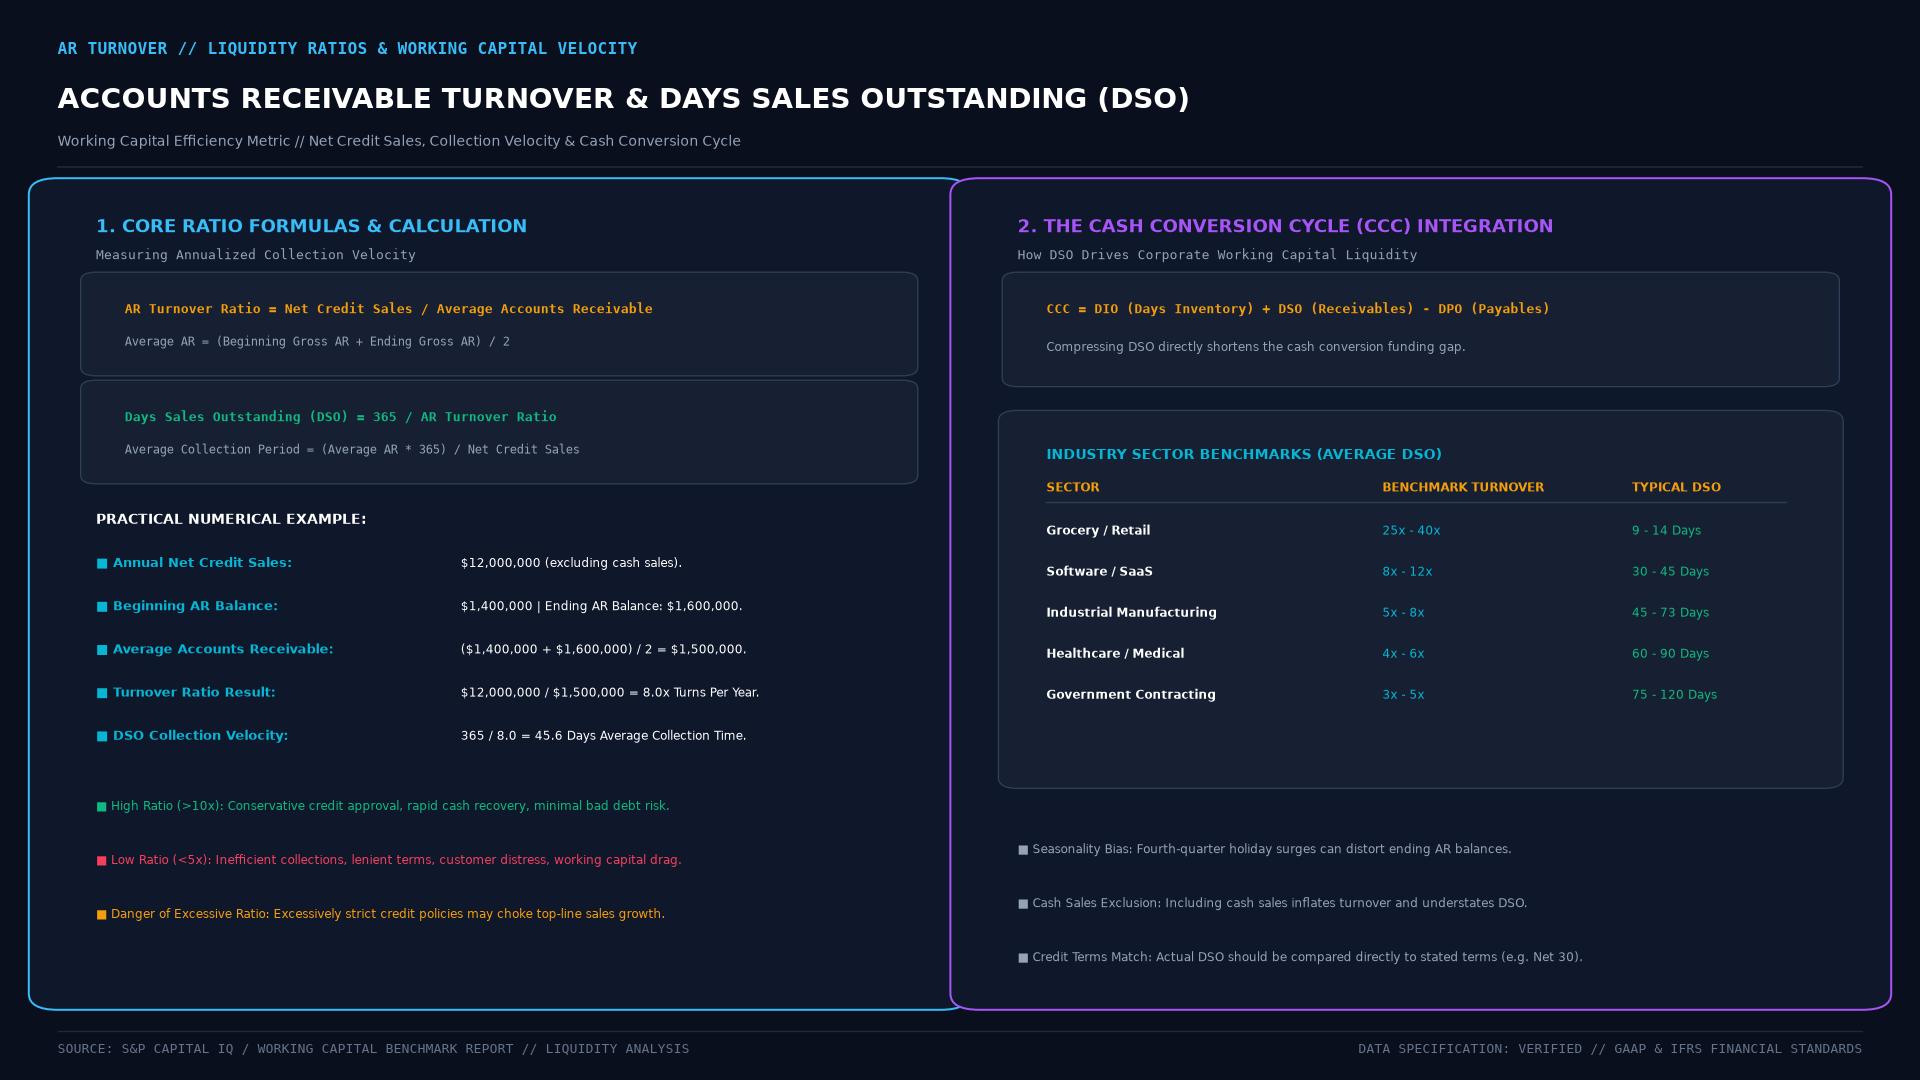 Figure: The Accounts Receivable Turnover ratio and Days Sales Outstanding (DSO) framework, detailing mathematical calculation formulas, practical numerical walkthroughs, Cash Conversion Cycle (CCC) integration, and industry sector collection benchmarks.
Technical Mechanics & Core Formulas
Financial analysts calculate the Accounts Receivable Turnover ratio and its corresponding time-based counterpart through standard corporate accounting equations:
1. The Accounts Receivable Turnover Formula
Accounts Receivable Turnover = Net Credit Sales / Average Accounts ReceivableWhere:
- Net Credit Sales: Total gross sales conducted on credit terms minus returns, allowances, and prompt-payment early discounts. Cash sales must be strictly excluded because they generate no accounts receivable.
- Average Accounts Receivable: The arithmetic mean of the starting and ending gross accounts receivable balances across the period:
Average Accounts Receivable = (Beginning AR + Ending AR) / 22. Days Sales Outstanding (DSO) / Average Collection Period
While the turnover ratio produces an annualized integer, corporate treasurers convert this figure into days to assess operational collection velocity:
Days Sales Outstanding (DSO) = 365 / Accounts Receivable Turnover RatioFor example, an AR turnover ratio of 8.0 indicates that the company turns its receivables eight times per year, yielding an average collection period of approximately 45.6 days ($365 / 8 = 45.625$).
Interpreting the Ratio: High vs. Low Receivables Velocity
Understanding what constitutes an optimal receivables turnover requires evaluating industry context and commercial credit terms:
High Turnover Ratio (Fast Collection)
- Positive Signals: Customers pay promptly within agreed discount windows, credit vetting minimizes delinquent debtors, and cash flow cycles remain short and predictable.
- Negative Risk: Excessively restrictive credit terms (e.g., demanding 7-day payment while competitors offer 30 days) can drive prospective buyers to competitors, suppressing aggregate top-line revenue.
Low Turnover Ratio (Slow Collection)
- Operational Vulnerabilities: Weak credit screening, lack of invoice follow-up, or customer disputes regarding product quality and shipping discrepancies.
- Systemic Liquidity Risk: Capital remains trapped in uncollected invoices, forcing the company to borrow expensive short-term working capital or draw on revolving credit lines to meet operating payroll.
Comparative Matrix: Receivables Velocity Across Industries
| Industry Sector | Typical Benchmark Turnover | Benchmark DSO | Primary Drivers of Collection Cycle |
|---|---|---|---|
| Wholesale Food & Grocery | 18.0x to 24.0x | 15 to 20 days | Perishable inventory, rapid cash turnover, tight retail terms |
| Consumer Electronics Manufacturing | 7.0x to 10.0x | 36 to 52 days | Staged supply-chain orders, retailer credit terms (net-30/45) |
| Enterprise Software (SaaS) | 6.0x to 8.5x | 42 to 60 days | Annual or quarterly billing, procurement legal review cycles |
| Heavy Construction & Infrastructure | 3.0x to 5.0x | 73 to 120 days | Milestone billing, complex retainage clauses, municipal approvals |
| Pharmaceutical Wholesale | 8.0x to 12.0x | 30 to 45 days | Standard net-30 distribution agreements, hospital payment schedules |
Real-World Case Study: Industrial Equipment Manufacturer Turnaround
In 2023, an industrial pump manufacturer with $48 million in annual credit sales experienced recurring working capital shortfalls despite an expanding order book. An audit revealed that its Accounts Receivable Turnover had dropped from 7.2x to 4.1x over 24 months, expanding its Days Sales Outstanding from 50.7 days to 89.0 days. Over $11.7 million in customer receivables sat uncollected.
Analysis showed that sales managers had been granting unvetted 90-day payment extensions to hit aggressive sales quotas. Management intervened by restructuring its commercial credit policy:
- Implemented a 2/10 net-30 prompt-payment incentive (2% cash discount if settled within 10 days).
- Instituted mandatory credit checks for any account credit line exceeding $50,000.
- Automated electronic invoice delivery and past-due notification workflows at 15, 30, and 45 days.
Within 12 months, the company’s AR turnover ratio rebounded to 7.8x, reducing DSO to 46.8 days. The accelerated collections unlocked $5.5 million in trapped cash, allowing the firm to pay down its high-interest bank line of credit and save $380,000 in annual interest expense.
Frequently Asked Questions (FAQ)
Should gross sales be used if net credit sales are unavailable?
When evaluating external public filings where companies do not separate cash sales from credit sales, equity analysts often substitute total net sales. While this provides a workable comparative estimate for B2B firms with negligible cash transactions, it distorts the calculation for retail businesses with high cash or debit card volume.
How does the allowance for doubtful accounts affect the turnover calculation?
Analysts recommend using gross accounts receivable before subtracting the allowance for doubtful accounts when calculating the turnover ratio. Using net receivables artificially reduces the denominator if management writes off bad debts aggressively, making collection efficiency appear deceptively high.
What is the relationship between AR Turnover and the Cash Conversion Cycle (CCC)?
Accounts Receivable Turnover is the direct determinant of the Days Sales Outstanding component of the Cash Conversion Cycle (CCC = Days Inventory Outstanding + Days Sales Outstanding - Days Payables Outstanding). Accelerating AR turnover reduces DSO, which shortens the entire CCC and boosts corporate return on invested capital (ROIC).
Ready to trade forex?
Open a free demo account with a regulated broker. Practice with virtual funds before risking real money.