Accumulation
Accumulation in trading refers to the phase in which large institutional buyers (funds, banks, large speculators) quietly build significant long positions in a currency or asset, typically during a period of sideways or compressed price action that disguises their activity. The accumulation phase precedes a significant upward move when the institutional buying is complete and retail participation follows.
The Concept Behind Accumulation
Institutional traders face a problem retail traders don’t: size. A hedge fund wanting to buy $500 million of EUR/USD cannot simply place one large market order — the market impact would dramatically move the price against them before the position is fully established. Instead, they spread purchases over time, buying in smaller increments across many sessions while price remains relatively contained.
This buying process — conducted at low prices before a major move — is called accumulation. The price action during accumulation typically appears boring: a range-bound market with no clear direction, modest volume, and little news-driven momentum. Retail traders often dismiss these periods as “consolidation” or a “dead” market. For patient institutional traders, it’s exactly when they’re building their positions.
The concept of accumulation was formalized by Richard Wyckoff in the early 20th century as part of his market cycle framework. Wyckoff studied how “composite operators” (his term for large institutional participants) prepared markets for large moves through deliberate accumulation and distribution phases.
Wyckoff’s Accumulation Schematic
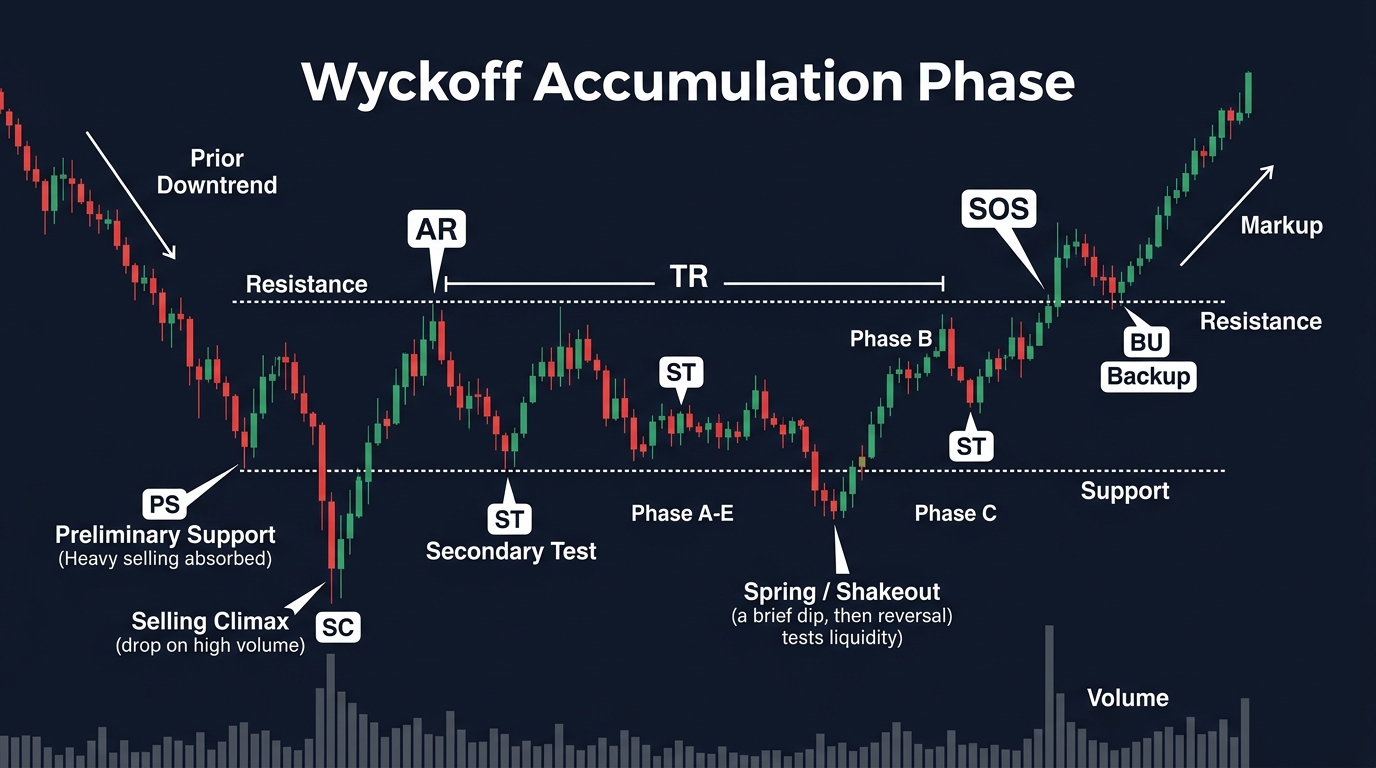
Wyckoff identified a specific pattern for how accumulation unfolds:
Phase A — Stopping the Prior Downtrend: Price has been declining. A “Preliminary Support” appears — buyers begin absorbing selling. A “Selling Climax” occurs — a sharp, high-volume spike down that exhausts sellers. An “Automatic Rally” follows as remaining sellers exit. A “Secondary Test” revisits the selling climax lows on lower volume, confirming the low is in.
Phase B — Building the Base: Price oscillates in a wide range. Institutions use this phase to accumulate positions — buying on dips toward support, allowing price to rise, selling a small amount at resistance to maintain the range, then buying again at support. Volume is elevated but variable.
Phase C — The Spring: A common (but not always present) feature — price makes one final false move below the range support (“spring”), triggering stop-losses of retail shorts before sharply reversing upward. This is the “shakeout” that flushes remaining weak hands. After the spring, volume often spikes on the bullish reversal.
Phase D — Breakout and Retest: Price breaks above the range. A “Last Point of Support” forms — a pullback to the former resistance now acting as support, offering a lower-risk entry. Institutional accumulation is now complete.
Phase E — The Uptrend: The sustained directional move begins. Price is now in a clear uptrend, with higher highs and higher lows. Most retail traders enter here — after the majority of the move has already occurred.
Identifying Accumulation in Practice
In real markets, textbook Wyckoff patterns rarely appear with perfect clarity. Practical indicators of accumulation:
- Flat, compressed price range: A currency pair that has traded within a 100-150 pip range for 3-6 weeks without clear directional break
- Declining volatility: ATR reaching multi-month lows — the Bollinger Band squeeze condition
- Support holding consistently: Each test of the range low holds, with bullish candlestick rejections (hammers, doji) at the bottom
- Volume on bounces exceeding volume on declines: On ECN data or equity equivalents, upward moves show more participation than downward moves — institutions are buying, not selling
Accumulation and Trading Strategy
Most retail traders are most profitable not by identifying accumulation itself, but by trading the breakout from accumulation. The compression that defines accumulation stores energy — when it releases, the move is often fast and significant.
Strategy:
- Identify a compressed, range-bound pair with support consistently holding
- Wait for the breakout above the range high with a strong, high-volume candle close
- Enter on the breakout or on the first retest of the broken range
- Target: minimum of 1x the range height projected from the breakout
Key Takeaways
- Accumulation is the institutional buying phase that precedes large upward moves
- It appears as sideways, range-bound price action while institutions quietly build positions
- Wyckoff’s schematic: Phase A (stop downtrend) → B (build base) → C (spring/shakeout) → D (breakout) → E (uptrend)
- Key identifiers: flat range, declining ATR, support holding with bullish rejections
- Most retail traders trade the breakout from accumulation rather than accumulation itself
FAQ
How long does accumulation last? It varies enormously — from a few weeks on lower timeframes to many months on weekly charts. The longer the accumulation period (the wider and longer the base), the larger the subsequent move tends to be: “the bigger the base, the higher the space” is a common technical observation.
Can accumulation be identified in real time? Partially. The indicators above provide supporting evidence, but the definitive confirmation only comes with the breakout. Many apparent accumulation patterns resolve as distribution (large positions being sold) instead, with a breakdown rather than breakout. This is why the breakout confirmation is essential before committing fully to a directional trade.
Ready to trade forex?
Open a free demo account with a regulated broker. Practice with virtual funds before risking real money.