Volume
Volume is the total quantity of shares, contracts, or currency lots transacted across a financial market during a given timeframe, serving as the definitive measure of market liquidity and institutional conviction.
Volume is the bedrock metric of market mechanics, quantifying the total turnover of financial instruments changing hands between buyers and sellers within a specified period (such as a 1-minute, 1-hour, or daily candle). While price charts show what the market did, volume reveals how much conviction and capital accompanied that move.
In foreign exchange trading, interpreting volume requires understanding market microstructure: because spot forex is an over-the-counter (OTC) marketplace lacking a centralized clearinghouse, traders utilize tick volume as an accurate statistical proxy for institutional activity.
Real Volume vs. Tick Volume in Forex
The decentralized nature of foreign exchange creates an important distinction between equity/futures volume and spot forex volume:
| Dimension | Real Volume (Exchange-Traded) | Tick Volume (Spot Forex) |
|---|---|---|
| Market Venue | Centralized exchanges (e.g., CME, NYSE) | Decentralized OTC interbank network / retail brokers |
| What It Measures | Exact count of shares or futures contracts executed | Frequency of price changes (ticks) within a given timeframe |
| Data Uniformity | Universal across all market participants | Specific to the liquidity pool of the individual broker or ECN |
| Institutional Accuracy | 100% exact transactional turnover | Highly correlated proxy (~85%–90% correlation with real volume) |
Why Tick Volume Works as an Institutional Proxy
In an electronic currency market, high-frequency algorithms and interbank dealers adjust bid and ask quotes rapidly when transaction activity accelerates. A candle with 4,000 price ticks represents vastly greater order flow, liquidity consumption, and commercial execution than a quiet candle with only 250 ticks. Empirical studies confirm that surges in tick volume consistently mirror institutional dollar volume.
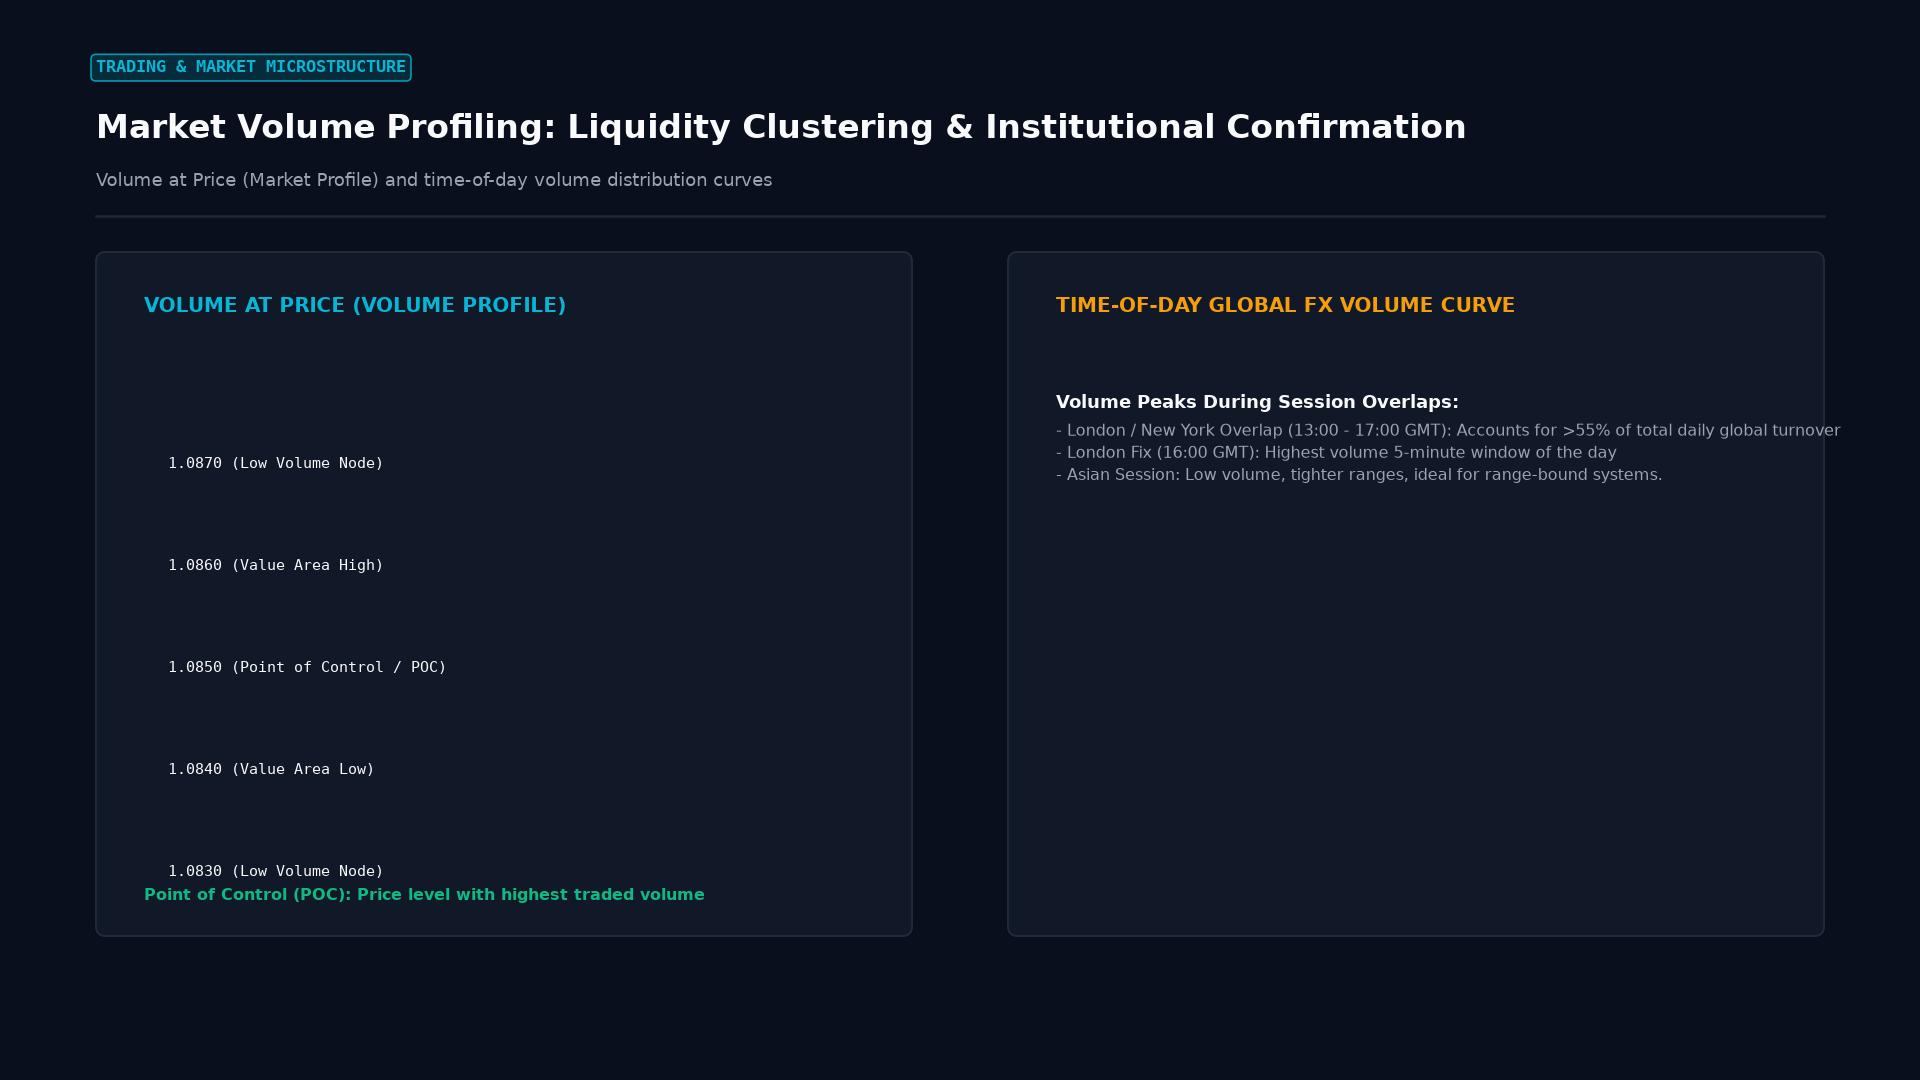 Figure: Volume analysis: Volume Profile Point of Control (POC) high-volume nodes versus global time-of-day London/New York session overlap peaks.
Core Principles of Volume Price Analysis (VPA)
Volume Price Analysis—rooted in the classical century-old methodologies of Richard Wyckoff—analyzes the relationship between candlestick price spread and accompanying volume:
- Effort vs. Result Validation:
- Healthy Trend Continuation: When a wide-range bullish candlestick is accompanied by high volume, “effort” (volume) matches “result” (price progress). The trend is authentic and institutionally supported.
- Exhaustion / Absorption: When high volume occurs on a narrow-range candle with long upper or lower wicks, smart money is absorbing opposite order flow, signaling an impending market reversal.
- Breakout Confirmation: An authentic breakout above key horizontal resistance must be accompanied by a noticeable volume spike. If price drifts above resistance on below-average volume, the move represents a “low-volume drift” that is highly susceptible to a false breakout trap.
- Volume Divergence: If an exchange rate registers higher highs on a daily chart while volume bars steadily diminish, the rally is losing institutional sponsorship.
Practical Example: Validating a Breakout on EUR/USD
Consider EUR/USD consolidating in a horizontal rectangle between 1.0820 (support) and 1.0880 (resistance) over three trading sessions:
- The Setup: The 20-period moving average of tick volume on the 1-hour chart sits at 1,200 ticks per bar.
- The Breakout Candle: During the London session open, a strong bullish marubozu candle breaks above 1.0880, closing at 1.0915.
- Volume Verification: The tick volume indicator prints 3,800 ticks on that single 1-hour breakout bar—more than triple the rolling average.
- Interpretation: The massive surge in volume confirms that institutional liquidity providers and commercial participants actively bought through resting sell orders at the 1.0880 resistance ceiling.
- Trade Execution: The trader enters long at 1.0920 on the candle close:
- Stop-Loss: Placed beneath the breakout support at 1.0865 (55 pips).
- Take-Profit: Targeted at the next major psychological level at 1.1030 (110 pips).
- Outcome: With genuine institutional momentum behind the move, EUR/USD continues rallying smoothly, achieving a clean 2:1 reward-to-risk gain.
Key Takeaways
- Conviction Metric: Volume measures the total turnover of financial contracts or currency lots over a specified period.
- Tick Volume Proxy: In decentralized spot forex, tick volume (the frequency of price quote updates) serves as a reliable proxy for real transaction volume.
- Breakout Confirmation: Genuine structural breakouts require elevated volume; low-volume breakouts carry high failure rates.
- Volume Divergence: Higher price highs accompanied by shrinking volume signal trend exhaustion and an impending reversal.
- Wyckoff Alignment: Analyzing the relationship between candle spread and volume reveals whether institutional capital is accumulating or distributing currency inventory.
Frequently Asked Questions
Can I see centralized real volume for currency trading?
Yes. While spot forex volume is decentralized, traders can view centralized real volume by tracking CME Currency Futures (such as the 6E Euro futures or 6J Japanese Yen futures) on exchanges like the Chicago Mercantile Exchange, where every single contract is publicly recorded.
What is On-Balance Volume (OBV)?
On-Balance Volume (OBV) is a cumulative momentum indicator that adds volume on up days and subtracts volume on down days. When OBV trends higher while price consolidates, it reveals subtle institutional accumulation ahead of an upward breakout.
Why does volume drop during the late New York and early Asian sessions?
Volume reflects international banking hours. As New York trading desks close at 5:00 PM EST and before Asian financial capitals (Tokyo, Singapore, Hong Kong) open in full force, global interbank market participation drops to its lowest daily levels, causing spreads to widen and volume to dry up.
Ready to trade forex?
Open a free demo account with a regulated broker. Practice with virtual funds before risking real money.